. 2013 Jun;123(6):2395-407.
doi: 10.1172/JCI66553. Epub 2013 May 8.

CXCR4 downregulation of let-7a drives chemoresistance in acute myeloid leukemia

Affiliations

CXCR4 downregulation of let-7a drives chemoresistance in acute myeloid leukemia

Ye Chen et al. J Clin Invest. 2013 Jun.

Abstract

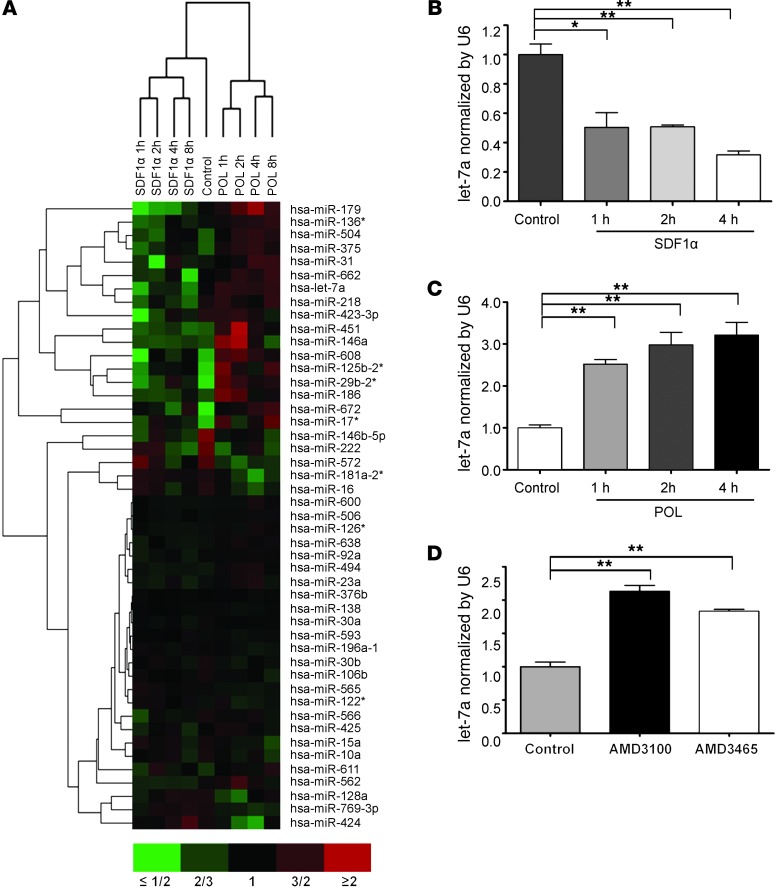
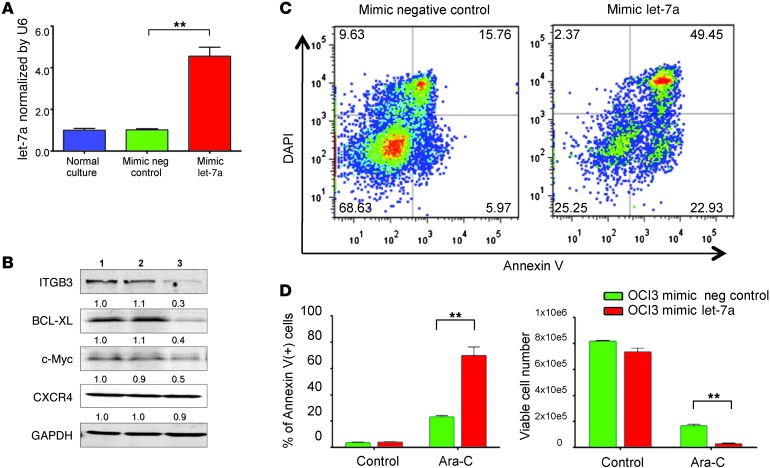
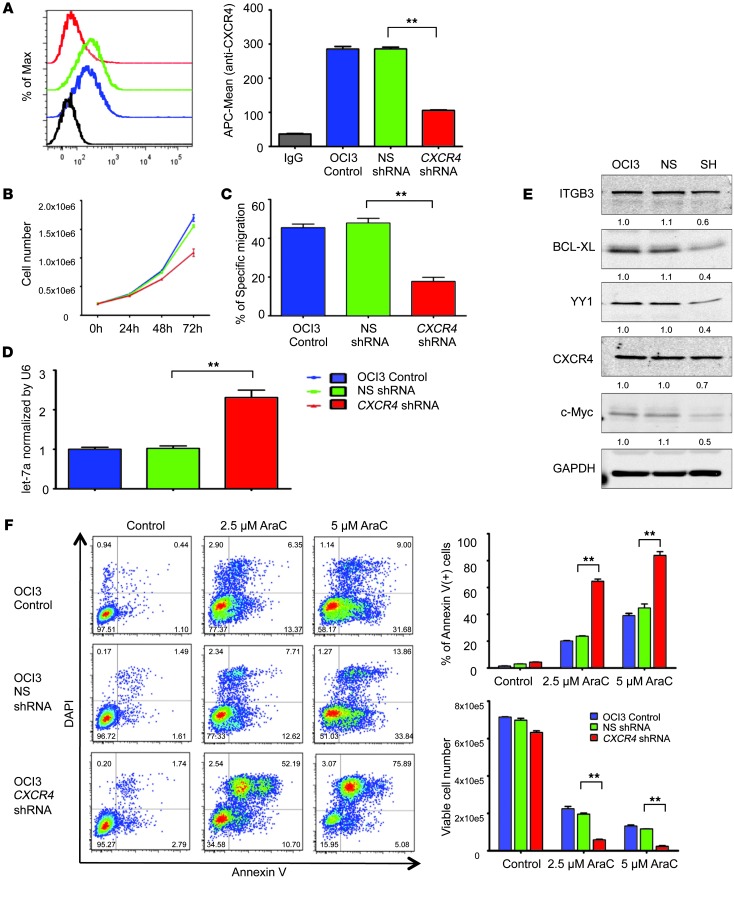
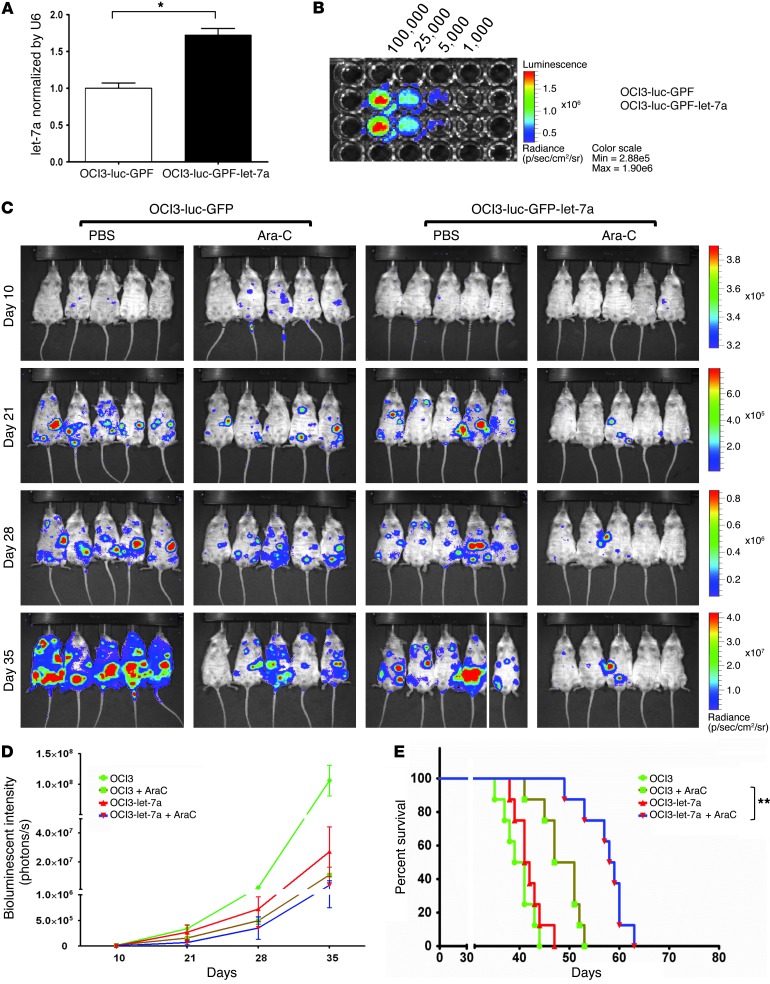
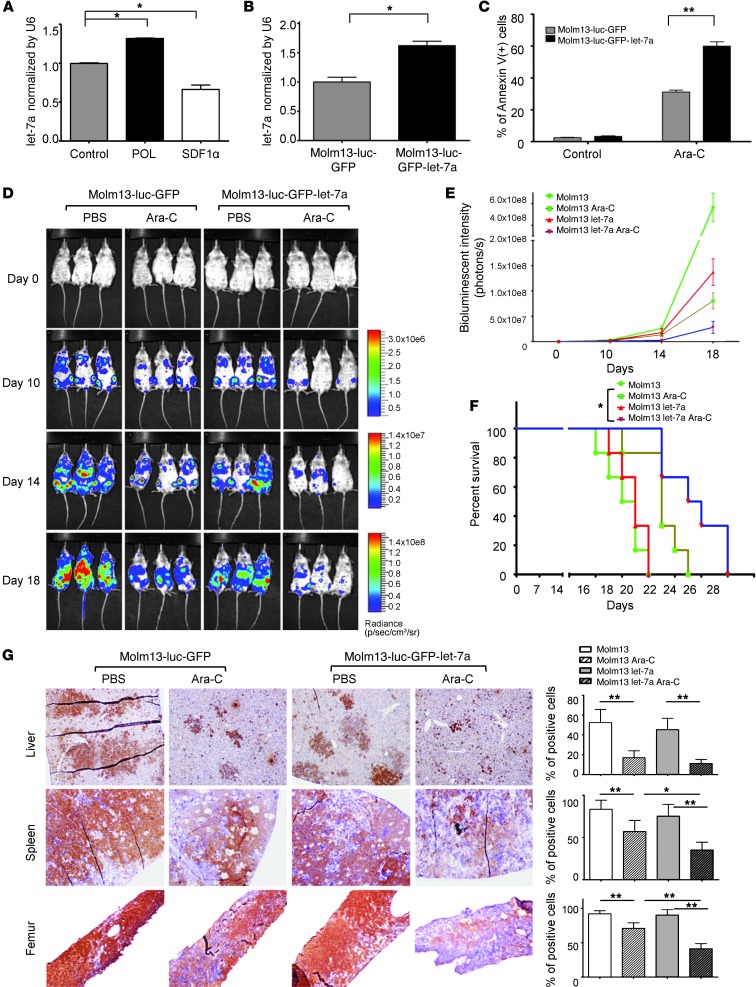
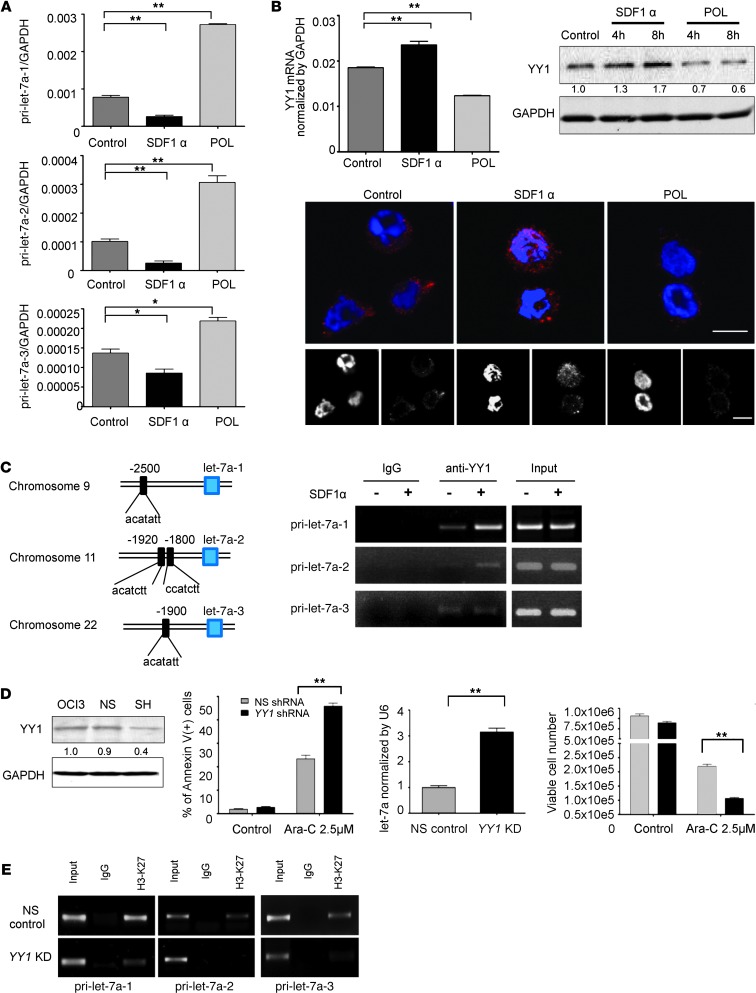
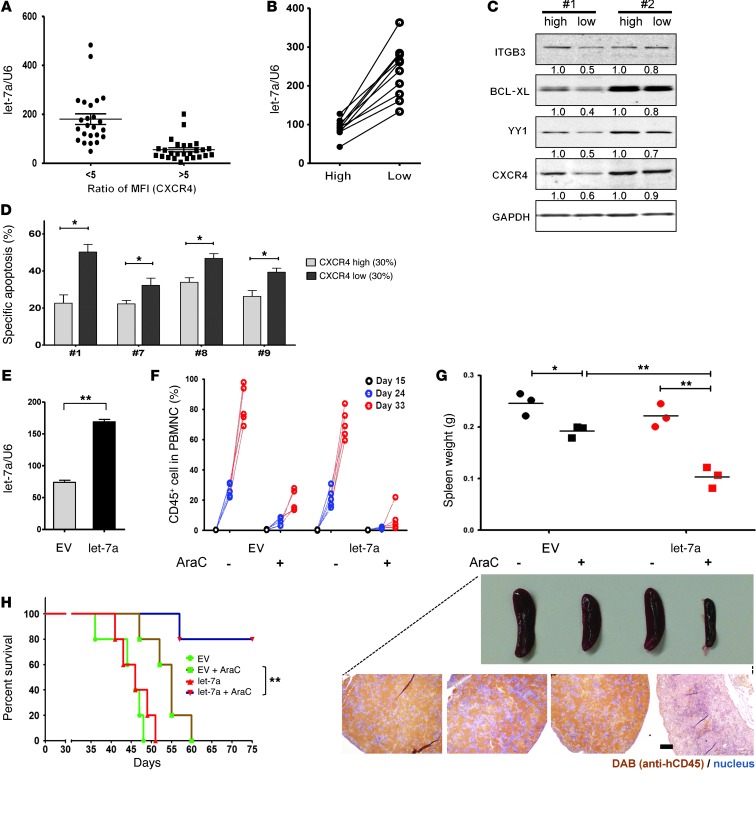
We examined the role of microRNAs (miRNAs) in targeting the stromal-derived factor 1α/CXCR4 (SDF-1α/CXCR4) axis to overcome chemoresistance of AML cells. Microarray analysis of OCI-AML3 cells revealed that the miRNA let-7a was downregulated by SDF-1α-mediated CXCR4 activation and increased by CXCR4 inhibition. Overexpression of let-7a in AML cell lines was associated with decreased c-Myc and BCL-XL protein expression and enhanced chemosensitivity, both in vitro and in vivo. We identified the transcription factor Yin Yang 1 (YY1) as a link between SDF-1α/CXCR4 signaling and let-7a, as YY1 was upregulated by SDF-1α and downregulated by treatment with a CXCR4 antagonist. ChIP assay confirmed the binding of YY1 to unprocessed let-7a DNA fragments, and treatment with YY1 shRNA increased let-7a expression. In primary human AML samples, high CXCR4 expression was associated with low let-7a levels. Xenografts of primary human AML cells engineered to overexpress let-7a exhibited enhanced sensitivity to cytarabine, resulting in greatly extended survival of immunodeficient mice. Based on these data, we propose that CXCR4 induces chemoresistance by downregulating let-7a to promote YY1-mediated transcriptional activation of MYC and BCLXL in AML cells.


Figures

Figure 1
Figure 1. CXCR4-mediated signaling influences miRNA profiles in OCI-AML3 cells.
(A) OCI-AML3 cells were treated with SDF-1α or POL6326, total RNA was extracted at specific time points, and mRNA expression profiling was performed. 47 miRNA probes were identified to be significantly changed in either direction with treatment. (B and C) qRT-PCR was performed to evaluate let-7a expression in response to SDF-1α (B) or POL6326 (C) treatment for the indicated times. (D) Upregulation of let-7a was also obtained in OCI-AML3 cells with administration of AMD CXCR4 inhibitors. *P < 0.05, **P < 0.01.
Figure 2
Figure 2. Transfection of synthetic let-7a sensitizes OCI-AML3 cells to Ara-C treatment.
Mimic let-7a or negative control oligonucleotide was transfected into OCI-AML3 cells by electroporation. (A) qRT-PCR showed that cells transfected with mimic had an approximately 3.5-fold increase of let-7a compared with control. (B) Western blots showed cells with mimic let-7a transfection had low expression of let-7a targets such as ITGB3, c-Myc, and BCL-XL. Lane 1, normal culture; lane 2, negative control oligonucleotide; lane 3, mimic let-7a. Expression level relative to normal culture (lane 1) is shown below blots. (C) When exposed to Ara-C (2.5 μM, 48 hours), the mimic let-7a–transfected cells exhibited >2-fold increased apoptosis (69.8% ± 9.4% vs. 23.2% ± 2.7% annexin V+; P < 0.01) and significantly lower numbers of viable cells (27,715 ± 6025 vs. 166,878 ± 12,405 cells; P < 0.01) compared with negative controls. **P < 0.01.
Figure 3
Figure 3. Knockdown of CXCR4 leads to upregulation of let-7a expression in OCI-AML3 cells.
CXCR4 was suppressed in OCI-AML3 cells with lentivirus-delivered CXCR4 shRNA. (A) The resulting CXCR4-shRNA-OCI3 cells had approximately 70% lower cell surface CXCR4 expression, as evaluated by flow cytometry. (B) CXCR4-shRNA-OCI3 cells grew slower than parental control and NS-shRNA-OCI3 cells. (C) In addition, approximately 60% less migration to SDF-1α was observed for CXCR4-shRNA-OCI3 cells. (D) qRT-PCR showed that let-7a was elevated in CXCR4-shRNA-OCI3 cells (∼2.3-fold the level in NS-shRNA-OCI3 cells). (E) As expected, let-7a–targeted genes such as MYC and BCLXL were decreased in CXCR4-shRNA-OCI3 cells. Expression level relative to parental OCI-AML3 cells is shown below blots. (F) CXCR4-shRNA-OCI3 cells exhibited significantly higher sensitivity to Ara-C, as shown by apoptosis rates and absolute viable cell counts. **P < 0.01.
Figure 4
Figure 4. let-7a strongly affects chemoresistance of OCI-AML3 cells in NSG mice.
(A) OCI3-luc-GFP-let-7a cells were established by lentiviral infection, and let-7a overexpression was confirmed by qRT-PCR. (B) Luciferase signals were similar between OCI3-luc-GFP-let-7a and control cells, as determined by bioluminescence imaging. (C) OCI3-luc-GFP-let-7a and control cells were transplanted into NSG mice (n = 8) for leukemia development, and mice were treated with PBS or Ara-C twice weekly from day 7 after cell injection. On days 10, 21, 28, and 35, mice were imaged after D-luciferin injection. Serial images of 5 representative mice at different time points are shown. (D) Bioluminescence imaging was quantified and expressed as luminescent intensity. (E) Overall survival rate in each group was estimated by Kaplan-Meier method. *P < 0.05, **P < 0.01.
Figure 5
Figure 5. Molm13 cells with overexpression of let-7a are more sensitive to chemotherapy in vitro and in vivo.
(A) Expression of let-7a in Molm13 cells was upregulated with POL6326 treatment and decreased with SDF-1α administration, as determined by qRT-PCR. (B) Molm13-luc-GFP-let-7a cells were established by lentiviral infection, which showed approximately 1.6-fold more let-7a compared with the scrambled control. (C) Molm13-luc-GFP-let-7a cells exhibited significantly higher sensitivity to Ara-C treatment in vitro. (D) Molm13-luc-GFP-let-7a and scrambled control cells were injected into NSG mice (n = 8), and the mice were treated with either PBS or Ara-C twice a week from day 7. Serial images of 3 representative mice on days 0, 10, 14, and 18 after D-luciferin injection are shown. (E) Bioluminescence imaging was quantified in terms of luminescent intensity. (F) Overall survival rate in each group was estimated by Kaplan-Meier method (*P < 0.05). (G) 3 representative mice per group were sacrificed on day 18, and tissues were fixed and sliced for immunohistochemistry staining with an anti-firefly antibody to specifically identify human leukemic cells. Analysis of spectral images further confirmed the significantly reduced leukemia burden in Ara-C–treated Molm13-luc-GFP-let-7a cells. Original magnification, ×20 (liver and spleen); ×4 (femur). *P < 0.05, **P < 0.01.
Figure 6
Figure 6. let-7a expression regulated by CXCR4 signaling is partially mediated though YY1.
(A) qRT-PCR demonstrated that pri-let-7a-1, pri-let-7a-2, and pri-let-7a-3 were downregulated by SDF-1α and upregulated with POL6326 treatment. (B) qRT-PCR, Western blotting, and immunocytochemistry confirmed the upregulation of YY1 with SDF-1α treatment and its reduction by CXCR4 antagonist at the mRNA and protein levels. Expression level relative to control is shown below blots. Scale bars: 10 μm. (C) Specific primers were designed for let-7a DNA fragments that include the YY1 binding sites. ChIP assay further confirmed that the interaction between YY1 and the pri-let-7a-1, pri-let-7a-2, and pri-let-7a-3 DNA fragments was enhanced by SDF-1α treatment. (D) YY1 expression in OCI-AML3 cells was knocked down by shRNA, and the cells showed a significantly higher level of let-7a compared with NS-shRNA-OCI3 cells. Moreover, YY1-shRNA-OCI3 cells were more sensitive to Ara-C treatment. Expression level relative to parental OCI-AML3 cells is shown below blots. (E) ChIP assays were performed with control IgG or antibody to H3K27 on the chromatin obtained from cells transfected with either control or YY1 shRNA. The immunoprecipitated chromatin was analyzed by PCR using specific primers (see Methods). *P < 0.05, **P < 0.01.
Figure 7
Figure 7. let-7a expression inversely correlates with surface CXCR4 expression and chemoresistance in AML patient samples.
(A) 50 AML patient samples were divided according to MFI ratio (anti-CXCR4 MFI/IgG MFI). Samples with higher MFI ratios (>5) had significantly higher let-7a expression than those with lower MFI ratios (<5) (P < 0.001; n = 25 per group). (B) 10 fresh AML samples were stained with CXCR4 antibody and sorted based on surface CXCR4 expression. The CXCR4hi subpopulation showed substantially less let-7a. (C) Western blot of samples 1 and 2 showed that let-7a targets, such as ITGB3 and BCL-XL, were expressed much less in the CXCR4lo subpopulation. Expression level relative to CXCR4hi cells is shown below blots. (D) The CXCR4lo subpopulation was more sensitive to Ara-C treatment. Specific apoptosis was calculated as (percent treatment apoptosis – percent spontaneous apoptosis)/(1 – percent spontaneous apoptosis) and expressed as a percentage. Results for samples 1, 7, 8, and 9 are shown. (E) Primary human AML cells were stably infected with let-7a or empty vector (EV) and expanded for xenograft models, which showed a 2.2-fold increase in let-7a versus control cells. (F) hCD45+ cells in mouse peripheral blood were determined using flow cytometry at different time points. hCD45+ cell percentage was significantly reduced with Ara-C treatment, which was more obvious in the let-7a–overexpressing group. (G) 3 representative mice per group were sacrificed on day 32. Spleens of the Ara-C–treated let-7a–overexpressing group were significantly smaller than the other groups, and immunohistochemical staining with anti-hCD45 antibody (original magnification, ×4) confirmed lower leukemia burden. Scale bar: 100 μm. (H) Median survival was significantly extended in the let-7a–overexpressing group compared with controls with Ara-C treatment. *P < 0.05, **P < 0.01.

Similar articles

Cited by

References

    1. Lowenberg B, Downing JR, Burnett A. Acute myeloid leukemia. N Engl J Med. 1999;341(14):1051–1062. doi: 10.1056/NEJM199909303411407. - DOI - PubMed
    1. Estey E, Döhner H. Acute myeloid leukaemia. Lancet. 2006;368(9550):1894–1907. doi: 10.1016/S0140-6736(06)69780-8. - DOI - PubMed
    1. Konopleva MY, Jordan CT. Leukemia stem cells and microenvironment: biology and therapeutic targeting. J Clin Oncol. 2011;29(5):591–599. doi: 10.1200/JCO.2010.31.0904. - DOI - PMC - PubMed
    1. Sipkins DA, et al. In vivo imaging of specialized bone marrow endothelial microdomains for tumour engraftment. Nature. 2005;435(7044):969–973. doi: 10.1038/nature03703. - DOI - PMC - PubMed
    1. Colmone A, Amorim M, Pontier AL, Wang S, Jablonski E, Sipkins DA. Leukemic cells create bone marrow niches that disrupt the behavior of normal hematopoietic progenitor cells. Science. 2008;322(5909):1861–1865. doi: 10.1126/science.1164390. - DOI - PubMed

Publication types

MeSH terms