Sensitivity of the Pig-a assay for detecting gene mutation in rats exposed acutely to strong clastogens
- PMID: 23677247
- PMCID: PMC3842102
- DOI: 10.1093/mutage/get022
Sensitivity of the Pig-a assay for detecting gene mutation in rats exposed acutely to strong clastogens
Abstract
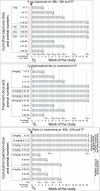
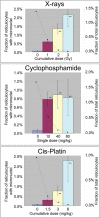
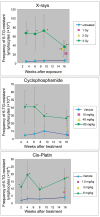
Clastogens are potential human carcinogens whose detection by genotoxicity assays is important for safety assessment. Although some endogenous genes are sensitive to the mutagenicity of clastogens, many genes that are used as reporters for in vivo mutation (e.g. transgenes) are not. In this study, we have compared responses in the erythrocyte Pig-a gene mutation assay with responses in a gene mutation assay that is relatively sensitive to clastogens, the lymphocyte Hprt assay, and in the reticulocyte micronucleus (MN) assay, which provides a direct measurement of clastogenicity. Male F344 rats were treated acutely with X-rays, cyclophosphamide (CP) and Cis-platin (Cis-Pt), and the frequency of micronucleated reticulocytes (MN RETs) in peripheral blood was measured 1 or 2 days later. The frequencies of CD59-deficient Pig-a mutant erythrocytes and 6-thioguanine-resistant Hprt mutant T-lymphocytes were measured at several times up to 16 weeks after the exposure. All three clastogens induced strong increases in the frequency of MN RETs, with X-rays and Cis-Pt producing near linear dose responses. The three agents also were positive in the two gene mutation assays although the assays detected them with different efficiencies. The Pig-a assay was more efficient in detecting the effect of Cis-Pt treatment, whereas the Hprt assay was more efficient for X-rays and CP. The results indicate that the erythrocyte Pig-a assay can detect the in vivo mutagenicity of clastogens although its sensitivity is variable in comparison with the lymphocyte Hprt assay.
Figures


Similar articles
-
Report on stage III Pig-a mutation assays using benzo[a]pyrene.Environ Mol Mutagen. 2011 Dec;52(9):731-7. doi: 10.1002/em.20675. Epub 2011 Aug 29. Environ Mol Mutagen. 2011. PMID: 22052432
-
Interlaboratory Pig-a gene mutation assay trial: Studies of 1,3-propane sultone with immunomagnetic enrichment of mutant erythrocytes.Environ Mol Mutagen. 2011 Dec;52(9):748-55. doi: 10.1002/em.20671. Epub 2011 Aug 29. Environ Mol Mutagen. 2011. PMID: 22052433
-
Report on stage III Pig-a mutation assays using N-ethyl-N-nitrosourea-comparison with other in vivo genotoxicity endpoints.Environ Mol Mutagen. 2011 Dec;52(9):721-30. doi: 10.1002/em.20686. Environ Mol Mutagen. 2011. PMID: 22167886
-
Evaluating the weak in vivo micronucleus response of a genotoxic carcinogen, aristolochic acids.Mutat Res. 2013 May 15;753(2):82-92. doi: 10.1016/j.mrgentox.2013.03.002. Epub 2013 Mar 14. Mutat Res. 2013. PMID: 23500662
-
Hprt mutant frequency and molecular analysis of Hprt mutations in rats treated with mutagenic carcinogens.Mutat Res. 1999 Dec 17;431(2):389-95. doi: 10.1016/s0027-5107(99)00181-5. Mutat Res. 1999. PMID: 10636003 Review.
Cited by
-
In vivo pig-a and micronucleus study of the prototypical aneugen vinblastine sulfate.Environ Mol Mutagen. 2018 Jan;59(1):30-37. doi: 10.1002/em.22122. Epub 2017 Aug 19. Environ Mol Mutagen. 2018. PMID: 28833575 Free PMC article.
-
Gamma radiation at a human relevant low dose rate is genotoxic in mice.Sci Rep. 2016 Sep 6;6:32977. doi: 10.1038/srep32977. Sci Rep. 2016. PMID: 27596356 Free PMC article.
-
Clonality, trafficking, and molecular alterations among Hprt mutant T lymphocytes isolated from control mice versus mice treated with N-ethyl-N-nitrosourea.Environ Mol Mutagen. 2023 Oct-Nov;64(8-9):432-457. doi: 10.1002/em.22579. Epub 2023 Nov 30. Environ Mol Mutagen. 2023. PMID: 37957787 Free PMC article.
-
Mutation Analysis in Cultured Cells of Transgenic Rodents.Int J Mol Sci. 2018 Jan 16;19(1):262. doi: 10.3390/ijms19010262. Int J Mol Sci. 2018. PMID: 29337872 Free PMC article.
-
Persistence of cisplatin-induced mutagenicity in hematopoietic stem cells: implications for secondary cancer risk following chemotherapy.Toxicol Sci. 2014 Aug 1;140(2):307-14. doi: 10.1093/toxsci/kfu078. Epub 2014 May 5. Toxicol Sci. 2014. PMID: 24798381 Free PMC article.
References
-
- Bryce S. M., Bemis J. C., Dertinger S. D. (2008). In vivo mutation assay based on the endogenous Pig-a locus. Environ. Mol. Mutagen., 49, 256–264 - PubMed
-
- Miura D., Dobrovolsky V. N., Kasahara Y., Katsuura Y., Heflich R. H. (2008). Development of an in vivo gene mutation assay using the endogenous Pig-A gene: I. Flow cytometric detection of CD59-negative peripheral red blood cells and CD48-negative spleen T-cells from the rat. Environ. Mol. Mutagen., 49, 614–621 - PubMed
-
- Dobrovolsky V. N., Shaddock J. G., Mittelstaedt R. A., Manjanatha M. G., Miura D., Uchikawa M., Mattison D. R., Morris S. M. (2009). Evaluation of Macaca mulatta as a model for genotoxicity studies. Mutat. Res., 673, 21–28 - PubMed
-
- Dobrovolsky V. N., Elespuru R. K., Bigger C. A., Robison T. W., Heflich R. H. (2011). Monitoring humans for somatic mutation in the endogenous PIG-a gene using red blood cells. Environ. Mol. Mutagen., 52, 784–794 - PubMed
Publication types
MeSH terms
Substances
Grants and funding
LinkOut - more resources
Full Text Sources
Other Literature Sources
Miscellaneous

