

Decreased mitochondrial OGG1 expression is linked to mitochondrial defects and delayed hepatoma cell growth
- PMID: 23677377
- PMCID: PMC3887880
- DOI: 10.1007/s10059-013-2343-4
Decreased mitochondrial OGG1 expression is linked to mitochondrial defects and delayed hepatoma cell growth
Abstract
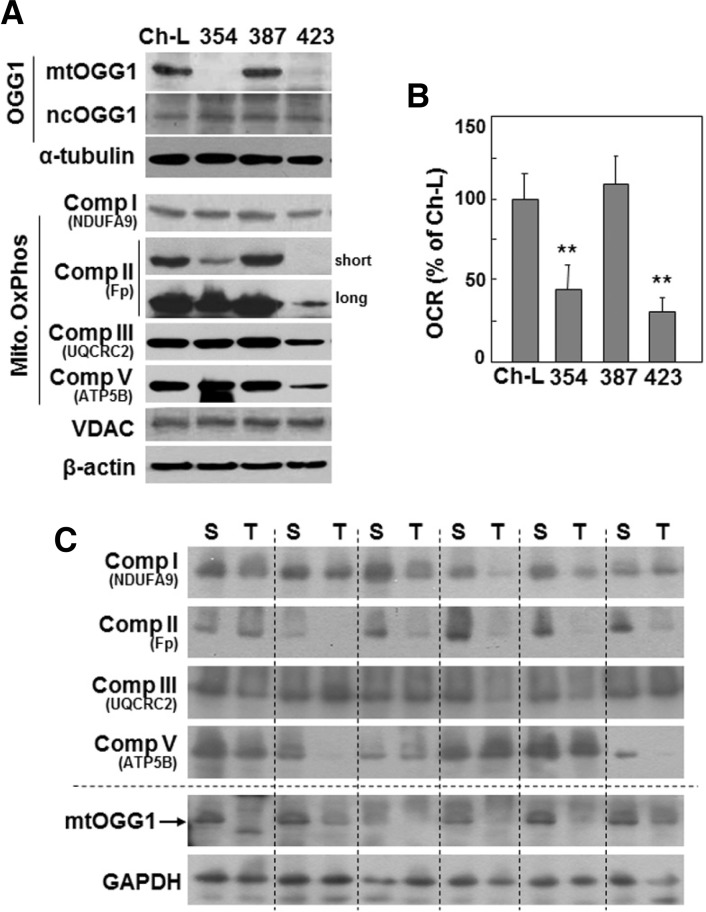
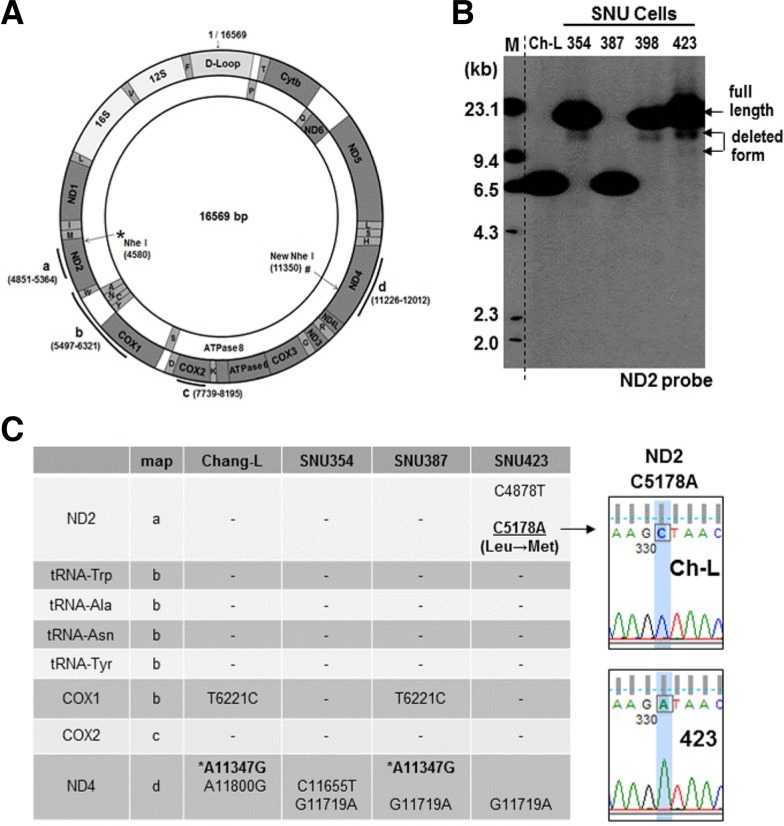
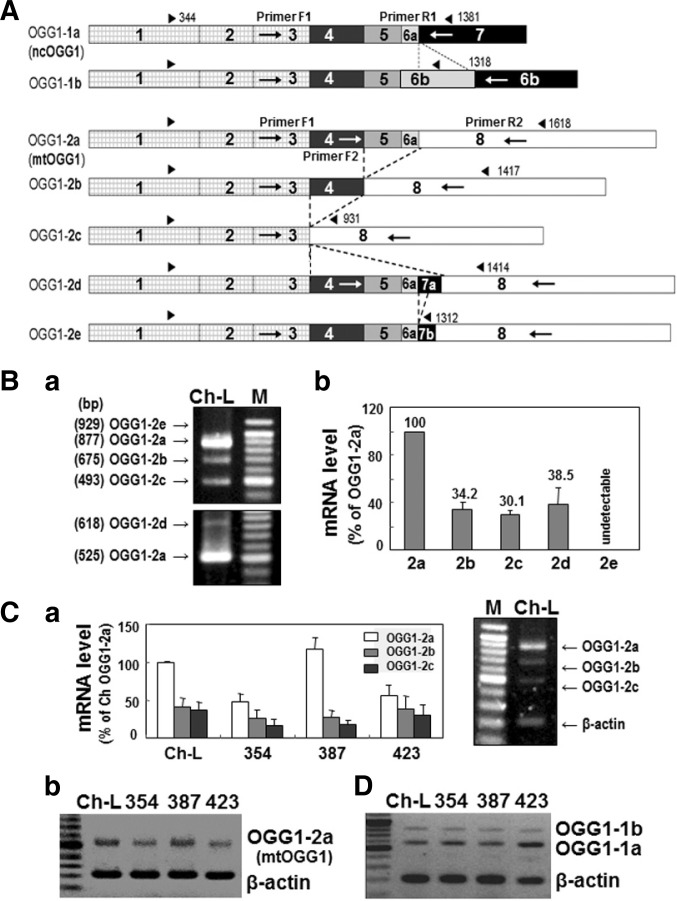
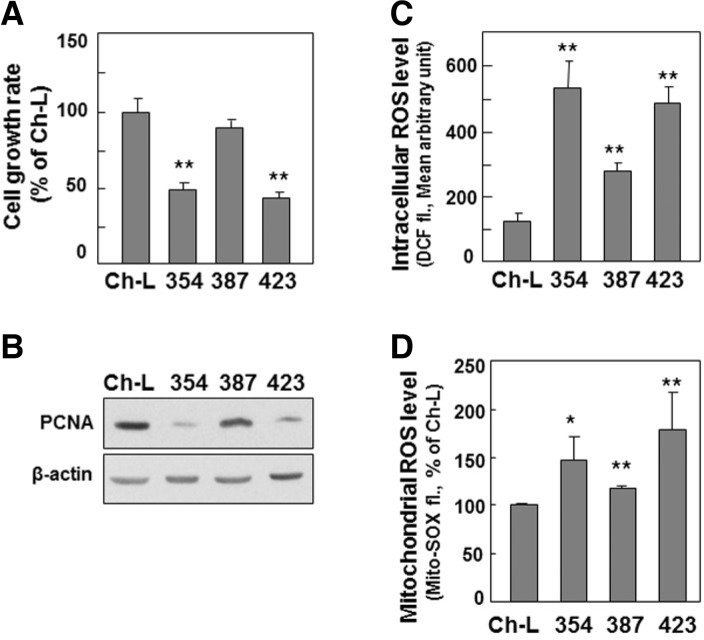
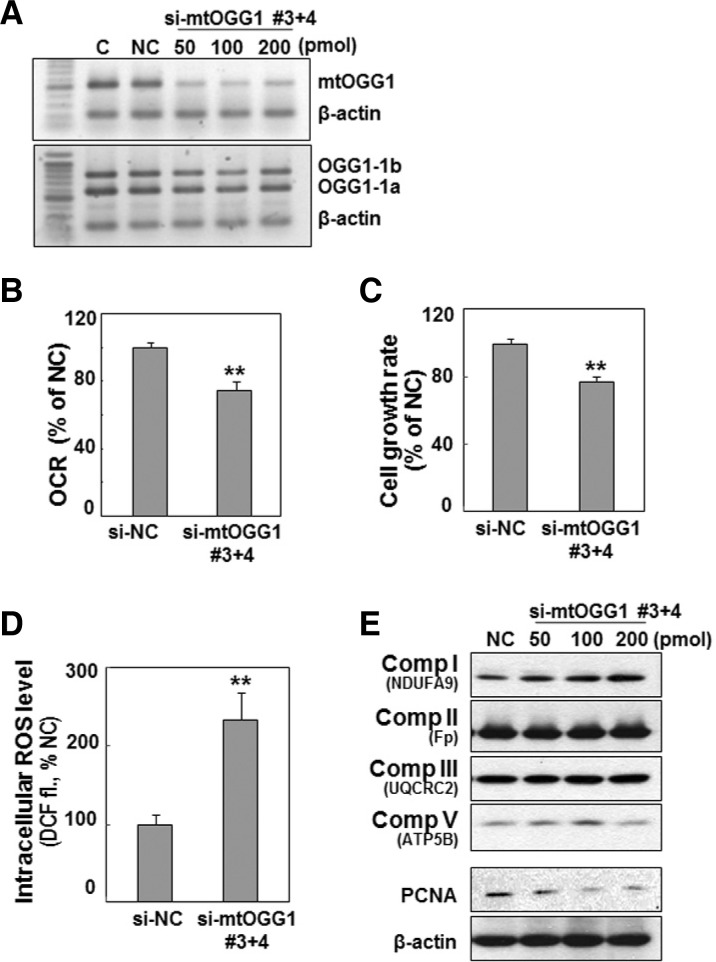
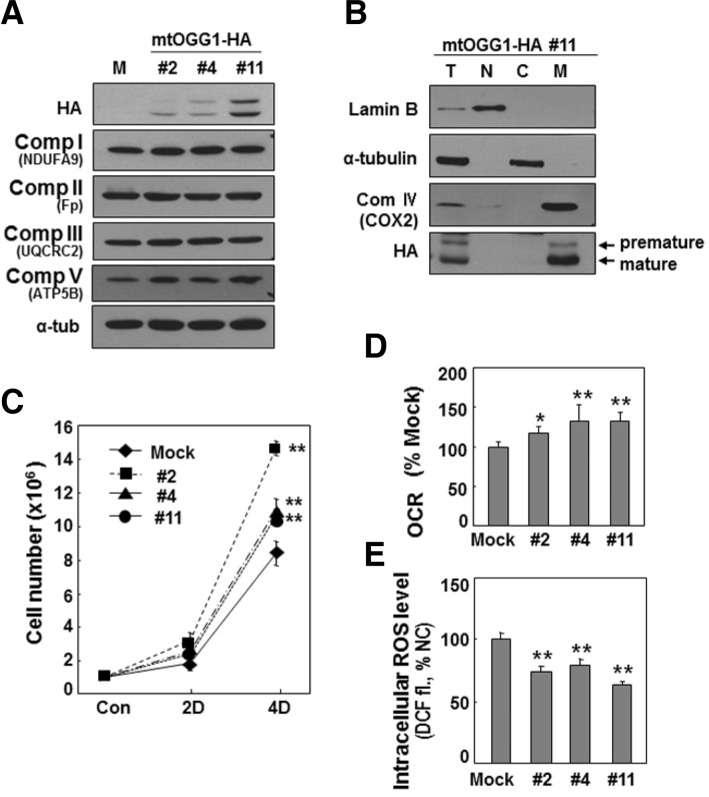
Many solid tumor cells exhibit mitochondrial respiratory impairment; however, the mechanisms of such impairment in cancer development remain unclear. Here, we demonstrate that SNU human hepatoma cells with declined mitochondrial respiratory activity showed decreased expression of mitochondrial 8-oxoguanine DNA glycosylase/lyase (mtOGG1), a mitochondrial DNA repair enzyme; similar results were obtained with human hepatocellular carcinoma tissues. Among several OGG1-2 variants with a mitochondrial-targeting sequence (OGG1-2a, -2b, -2c, -2d, and -2e), OGG1-2a was the major mitochondrial isoform in all examined hepatoma cells. Interestingly, hepatoma cells with low mtOGG1 levels showed delayed cell growth and increased intracellular reactive oxygen species (ROS) levels. Knockdown of OGG1-2 isoforms in Chang-L cells, which have active mitochondrial respiration with high mtOGG1 levels, significantly decreased cellular respiration and cell growth, and increased intracellular ROS. Overexpression of OGG1-2a in SNU423 cells, which have low mtOGG1 levels, effectively recovered cellular respiration and cell growth activities, and decreased intracellular ROS. Taken together, our results suggest that mtOGG1 plays an important role in maintaining mitochondrial respiration, thereby contributing to cell growth of hepatoma cells.
Figures
Similar articles
-
Mitochondrial Respiratory Dysfunction Induces Claudin-1 Expression via Reactive Oxygen Species-mediated Heat Shock Factor 1 Activation, Leading to Hepatoma Cell Invasiveness.J Biol Chem. 2015 Aug 28;290(35):21421-31. doi: 10.1074/jbc.M115.654913. Epub 2015 Jul 8. J Biol Chem. 2015. PMID: 26157141 Free PMC article.
-
Mitochondrial OGG1 expression reduces age-associated neuroinflammation by regulating cytosolic mitochondrial DNA.Free Radic Biol Med. 2023 Jul;203:34-44. doi: 10.1016/j.freeradbiomed.2023.03.262. Epub 2023 Apr 1. Free Radic Biol Med. 2023. PMID: 37011700 Free PMC article.
-
Staphylococcus aureus sepsis and mitochondrial accrual of the 8-oxoguanine DNA glycosylase DNA repair enzyme in mice.Am J Respir Crit Care Med. 2011 Jan 15;183(2):226-33. doi: 10.1164/rccm.200911-1709OC. Epub 2010 Aug 23. Am J Respir Crit Care Med. 2011. PMID: 20732986 Free PMC article.
-
An active alternative splicing isoform of human mitochondrial 8-oxoguanine DNA glycosylase (OGG1).Genes Environ. 2015 Oct 1;37:21. doi: 10.1186/s41021-015-0021-9. eCollection 2015. Genes Environ. 2015. PMID: 27350816 Free PMC article. Review.
-
The OGG1 gene encodes a repair enzyme for oxidatively damaged DNA and is involved in human carcinogenesis.Antioxid Redox Signal. 2001 Aug;3(4):597-609. doi: 10.1089/15230860152542952. Antioxid Redox Signal. 2001. PMID: 11554447 Review.
Cited by
-
Honokiol, an activator of Sirtuin-3 (SIRT3) preserves mitochondria and protects the heart from doxorubicin-induced cardiomyopathy in mice.Oncotarget. 2017 May 23;8(21):34082-34098. doi: 10.18632/oncotarget.16133. Oncotarget. 2017. PMID: 28423723 Free PMC article.
-
Progression of Hepatic Adenoma to Carcinoma in Ogg1 Mutant Mice Induced by Phenobarbital.Oxid Med Cell Longev. 2017;2017:8541064. doi: 10.1155/2017/8541064. Epub 2017 Jul 13. Oxid Med Cell Longev. 2017. PMID: 28785378 Free PMC article.
-
Lactate-mediated mitoribosomal defects impair mitochondrial oxidative phosphorylation and promote hepatoma cell invasiveness.J Biol Chem. 2017 Dec 8;292(49):20208-20217. doi: 10.1074/jbc.M117.809012. Epub 2017 Oct 4. J Biol Chem. 2017. PMID: 28978646 Free PMC article.
-
OGG1 contributes to hepatocellular carcinoma by promoting cell cycle-related protein expression and enhancing DNA oxidative damage repair in tumor cells.J Clin Lab Anal. 2022 Jul;36(7):e24561. doi: 10.1002/jcla.24561. Epub 2022 Jun 19. J Clin Lab Anal. 2022. PMID: 35723423 Free PMC article.
-
Isoforms of Base Excision Repair Enzymes Produced by Alternative Splicing.Int J Mol Sci. 2019 Jul 3;20(13):3279. doi: 10.3390/ijms20133279. Int J Mol Sci. 2019. PMID: 31277343 Free PMC article. Review.
References
-
- Anderson S, Bankier AT, Barrell BG, de Bruijn MH, Coulson AR, Drouin J, Eperon IC, Nierlich DP, Roe BA, Sanger F, et al. (1981). Sequence and organization of the human mitochondrial genome. Nature. 290, 457–465 - PubMed
-
- Andrews RM, Kubacka I, Chinnery PF, Lightowlers RN, Turnbull DM, Howell N. (1999). Reanalysis and revision of the Cambridge reference sequence for human mitochondrial DNA. Nat Genet. 23, 147. - PubMed
-
- Berneburg M, Kamenisch Y, Krutmann J, Rocken M. (2006). ‘To repair or not to repair - no longer a question’: repair of mitochondrial DNA shielding against age and cancer. Exp Dermatol. 15, 1005–1015 - PubMed
-
- Bogenhagen DF, Pinz KG, Perez-Jannotti RM. (2001). Enzymology of mitochondrial base excision repair. Prog Nucleic Acid Res Mol Biol. 68, 257–271 - PubMed
Publication types
MeSH terms
Substances
LinkOut - more resources
Full Text Sources
Other Literature Sources
Medical
Research Materials
