

Highly rapid amplification-free and quantitative DNA imaging assay
- PMID: 23677392
- PMCID: PMC3655336
- DOI: 10.1038/srep01852
Highly rapid amplification-free and quantitative DNA imaging assay
Abstract
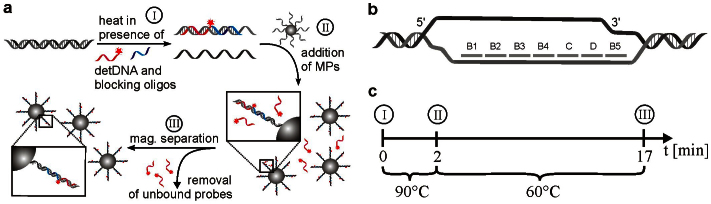
There is an urgent need for rapid and highly sensitive detection of pathogen-derived DNA in a point-of-care (POC) device for diagnostics in hospitals and clinics. This device needs to work in a 'sample-in-result-out' mode with minimum number of steps so that it can be completely integrated into a cheap and simple instrument. We have developed a method that directly detects unamplified DNA, and demonstrate its sensitivity on realistically sized 5 kbp target DNA fragments of Micrococcus luteus in small sample volumes of 20 μL. The assay consists of capturing and accumulating of target DNA on magnetic beads with specific capture oligonucleotides, hybridization of complementary fluorescently labeled detection oligonucleotides, and fluorescence imaging on a miniaturized wide-field fluorescence microscope. Our simple method delivers results in less than 20 minutes with a limit of detection (LOD) of ~5 pM and a linear detection range spanning three orders of magnitude.
Figures
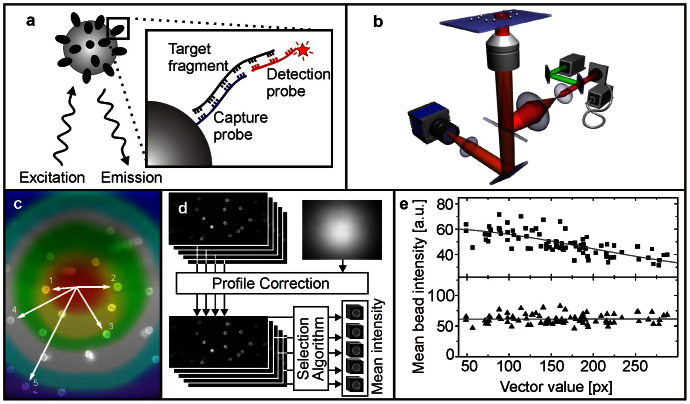
 Raw and
  profile corrected intensity values.
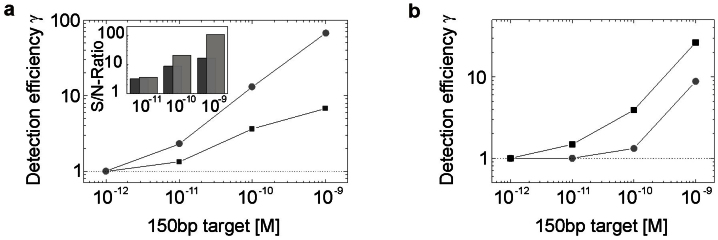
 High-end fluorescence microscope,
  miniaturized optical breadboard. (b) The substitution of
  DNA capturing probes by
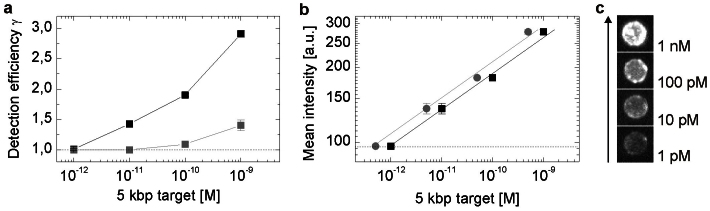
  LNA modified strands increases the detection sensitivity. Dotted lines display the mean blank sample intensity level, the detection efficiency γ is defined as the ratio of specific to unspecific fluorescence signal. Error bars representing the standard error of mean bead intensities (SEM, n = 60–89 beads) of acquired images are smaller than data points.
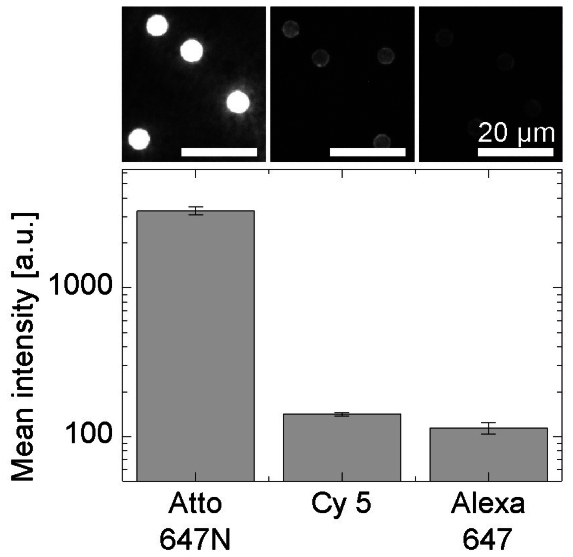
 Alexa Fluor 647,
  Atto 647N. (b) Mean fluorescence intensity values of 5 kbp DNA fragment using Alexa 647 labeled detection probes.
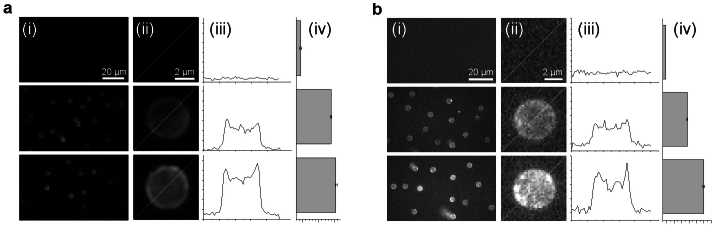
  Concentration of target fragments in spiked samples introduced in the assay,
  final concentration while incubation phase. (c) Visualization of increasing bead brightness with ascending target concentration using the Atto 647N label. Dotted lines display the mean blank sample intensity level; error bars represent the standard error of mean bead intensities (SEM, n = 53–97). Solid lines are guides to the eye. Error bars of (a) indicate the standard error of mean intensity (SEM) between three independent measurements demonstrating the reliability of the parameter.
Similar articles
-
Immunoassay on a power-free microchip with laminar flow-assisted dendritic amplification.Anal Chem. 2007 Aug 1;79(15):6000-4. doi: 10.1021/ac070659o. Epub 2007 Jul 6. Anal Chem. 2007. PMID: 17614367
-
A cytometric bead assay for sensitive DNA detection based on enzyme-free signal amplification of hybridization chain reaction.Biosens Bioelectron. 2013 Nov 15;49:380-6. doi: 10.1016/j.bios.2013.05.055. Epub 2013 Jun 7. Biosens Bioelectron. 2013. PMID: 23807231
-
A dual amplification strategy for DNA detection combining bio-barcode assay and metal-enhanced fluorescence modality.Chem Commun (Camb). 2014 Nov 11;50(87):13373-6. doi: 10.1039/c4cc05554c. Epub 2014 Sep 18. Chem Commun (Camb). 2014. PMID: 25233044
-
Optical detection of DNA and proteins with cationic polythiophenes.Acc Chem Res. 2008 Feb;41(2):168-78. doi: 10.1021/ar700115t. Epub 2008 Jan 17. Acc Chem Res. 2008. PMID: 18198841 Review.
-
Fluorescent Biosensors Based on Single-Molecule Counting.Acc Chem Res. 2016 Sep 20;49(9):1722-30. doi: 10.1021/acs.accounts.6b00237. Epub 2016 Sep 1. Acc Chem Res. 2016. PMID: 27583695 Review.
Cited by
-
Integration of programmable microfluidics and on-chip fluorescence detection for biosensing applications.Biomicrofluidics. 2014 Sep 30;8(5):054111. doi: 10.1063/1.4897226. eCollection 2014 Sep. Biomicrofluidics. 2014. PMID: 25584111 Free PMC article.
-
Optofluidic analysis system for amplification-free, direct detection of Ebola infection.Sci Rep. 2015 Sep 25;5:14494. doi: 10.1038/srep14494. Sci Rep. 2015. PMID: 26404403 Free PMC article.
-
Multiplexed efficient on-chip sample preparation and sensitive amplification-free detection of Ebola virus.Biosens Bioelectron. 2017 May 15;91:489-496. doi: 10.1016/j.bios.2016.12.071. Epub 2017 Jan 3. Biosens Bioelectron. 2017. PMID: 28073029 Free PMC article.
-
Droplet Digital Enzyme-Linked Oligonucleotide Hybridization Assay for Absolute RNA Quantification.Sci Rep. 2015 Sep 3;5:13795. doi: 10.1038/srep13795. Sci Rep. 2015. PMID: 26333806 Free PMC article.
-
An open-source software analysis package for Microspheres with Ratiometric Barcode Lanthanide Encoding (MRBLEs).PLoS One. 2019 Mar 22;14(3):e0203725. doi: 10.1371/journal.pone.0203725. eCollection 2019. PLoS One. 2019. PMID: 30901328 Free PMC article.
References
-
- Southern E. M. Detection of specific sequences among DNA fragments feparated by Gel-Electrophoresis. Journal of Molecular Biology 98, 503–517 (1975). - PubMed
-
- Meinkoth J. & Wahl G. Hybridization of nucleic acids immobilized on solid supports. Anal. Biochem. 138, 267–284 (1984). - PubMed
-
- Relman D. A., Loutit J. S., Schmidt T. M., Falkow S. & Tompkins L. S. The agent of bacillary angiomatosis. An approach to the identification of uncultured pathogens. N. Engl. J. Med. 323, 1573–1580 (1990). - PubMed
-
- Brandt S., Kloska S., Altmann T. & Kehr J. Using array hybridization to monitor gene expression at the single cell level. J. Exp. Bot. 53, 2315–2323 (2002). - PubMed
Publication types
MeSH terms
Substances
LinkOut - more resources
Full Text Sources
Other Literature Sources
