. 2013 Jun 15;190(12):5992-6003.
doi: 10.4049/jimmunol.1201359. Epub 2013 May 15.

B lymphocyte "original sin" in the bone marrow enhances islet autoreactivity in type 1 diabetes-prone nonobese diabetic mice

Affiliations

B lymphocyte "original sin" in the bone marrow enhances islet autoreactivity in type 1 diabetes-prone nonobese diabetic mice

Rachel A Henry-Bonami et al. J Immunol. .

Abstract

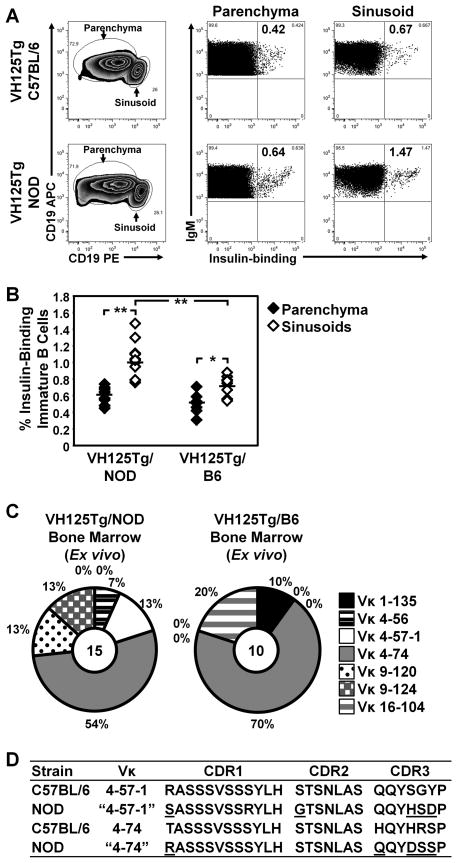
Effective central tolerance is required to control the large extent of autoreactivity normally present in the developing B cell repertoire. Insulin-reactive B cells are required for type 1 diabetes in the NOD mouse, because engineered mice lacking this population are protected from disease. The Cg-Tg(Igh-6/Igh-V125)2Jwt/JwtJ (VH125Tg) model is used to define this population, which is found with increased frequency in the periphery of NOD mice versus nonautoimmune C57BL/6 VH125Tg mice; however, the ontogeny of this disparity is unknown. To better understand the origins of these pernicious B cells, anti-insulin B cells were tracked during development in the polyclonal repertoire of VH125Tg mice. An increased proportion of insulin-binding B cells is apparent in NOD mice at the earliest point of Ag commitment in the bone marrow. Two predominant L chains were identified in B cells that bind heterologous insulin. Interestingly, Vκ4-57-1 polymorphisms that confer a CDR3 Pro-Pro motif enhance self-reactivity in VH125Tg/NOD mice. Despite binding circulating autoantigen in vivo, anti-insulin B cells transition from the parenchyma to the sinusoids in the bone marrow of NOD mice and enter the periphery unimpeded. Anti-insulin B cells expand at the site of autoimmune attack in the pancreas and correlate with increased numbers of IFN-γ-producing cells in the repertoire. These data identify the failure to cull autoreactive B cells in the bone marrow as the primary source of anti-insulin B cells in NOD mice and suggest that dysregulation of central tolerance permits their escape into the periphery to promote disease.


Figures

Figure 1
Figure 1. Increased formation of anti-insulin B cells initiates in the BM of T1D-prone VH125Tg/NOD mice
(A) Freshly isolated BM from B6 or NOD VH transgenic (anti-insulin VH125 or non-insulin-binding VH281) or WT mice was phenotyped using high throughput flow cytometry analysis. Cells were gated on B220mid IgMa+ live lymphocytes to show immature B cells. Parallel samples were incubated with 10-fold excess unlabeled insulin to demonstrate a specific interaction of the BCR with insulin; specific insulin-binding was calculated as in Methods. B6 (black) and NOD (white) mice are shown; WT (triangles), VH125Tg (diamonds), and VH281Tg (circles) are shown. Results for individual 5–19 wk old mice are plotted, n ≥ 7 mice, n ≥ 4 experiments. (B–C) BM B cells from B6 or NOD VH transgenic animals (anti-insulin VH125 or non-insulin-binding VH281) were cultured with IL-7 for 5 d to enrich for Ag-naïve B cells. IL-7 was withdrawn, and cells were cultured in the absence of exogenous insulin for an additional 2 d. (B) The frequency of insulin-specific B cells was determined as above, representative flow cytometry plots are shown. (C) Results from individual mice are plotted: B6 (black), NOD (white), VH125Tg (diamonds), and VH281Tg (circles), n ≥ 6 5-19 wk old mice, n ≥ 4 experiments. * p < 0.01, ** p < 0.001, as calculated by a two-tailed t-test.
Figure 2
Figure 2. The increase in anti-insulin B cell frequency is first apparent in the BM sinusoids of VH125Tg/NOD mice that harbor polymorphic anti-insulin Vκ4 genes that alter CDR composition
(A–B) Flow cytometry was used to identify live, B220mid IgMa+ lymphocytes (immature B cells) in freshly isolated B6 or NOD VH125Tg BM which had been labeled to detect parenchymal (CD19-PElow) and sinusoidal (CD19-PEhigh) B cells as in Methods. Insulin-binding B cells were detected with biotinylated human insulin. A) Representative flow cytometry plots depicting the frequency of insulin-binding B cells are shown. B) Summary graph is shown, parenchyma (black) and sinusoids (white). n ≥ 9 5-13 wk old mice, n = 3 experiments, * p < 0.01, ** p < 0.001, as calculated by a two-tailed t-test. (C) Flow cytometry sorting was used to isolate insulin-binding immature B cells (B220+ IgMa+ CD23 lymphocytes) identified with biotin-insulin from freshly isolated bone marrow. n = 6 VH125Tg/NOD mice, n = 2 experiments, n = 15 clones, KC484537-KC484551; n = 15 VH125Tg/C57BL/6 mice, n = 2 experiments, n = 10 clones, KC484552-KC484561. Mice were 6–17 wk old. Expressed Vκ genes were cloned, sequenced, and identified using IMGT and IgBLAST as in Methods. Vκ usage is shown. For each Vκ isolated, the total # of clones is shown within the pie chart; representation frequency is shown outside of the pie chart border. Sequences were deposited into GenBank under the accession numbers indicated. (D) Comparison of CDR composition of insulin-binding Vκ4 genes identified in panel C.
Figure 3
Figure 3. The BM parenchyma is the initial site of endogenous insulin encounter, which more highly occupies the BCR of anti-insulin B cells in the sinusoids of VH125Tg/NOD mice
(A) Schematic, left, of mAb123 recognition of insulin-occupied BCR. Representative flow cytometry plots are shown for insulin-binding (VH125Tg, n = 6) or negative control non-insulin-binding (VH281Tg, n = 6) NOD spleens stained with mAb123 or isotype control Ab, right. B220+ IgM+ live lymphocytes are shown. (B–D) Parenchymal (CD19-PElow) and sinusoidal (CD19-PEhigh) immature (CD19+ IgM+ CD23) live lymphocyte gated B cells were identified from VH125Tg or VH281Tg NOD and B6 mice using injected CD19-PE as in Methods. BM cells were pre-incubated with Fc Block prior to subsequent Ab staining (which did not alter staining profiles or anti-insulin frequencies detected, not shown), and then stained with mAb123-biotin to detect BCRs occupied with endogenous rodent insulin and other surface marker Ab. (B) Representative plots are shown. (C–D) Summary graphs show n ≥ 4 individually plotted 10–16 wk old mice, n = 2 experiments. Parenchyma (black) and sinusoids (white) immature mAb123-stained B cells are identified as above. (C) % Insulin-Occupied Immature B Cells (mAb123+), p < 0.001 for all comparisons of VH125Tg with negative control VH281Tg mice. (D) The mAb123 MFI of mAb123+ immature parenchymal or sinusoidal B cells is plotted to show the level of insulin occupancy on mAb123+ cells. * p < 0.05, ** p < 0.01, *** p < 0.001 as calculated by a two-tailed t-test.
Figure 4
Figure 4. Vκ polymorphisms enhance insulin autoreactivity in VH125Tg/NOD mice
VH125Tg B6 or NOD mice were immunized in a T-independent manner with heterologous insulin and hybridomas were generated as in Methods. Clones producing antibody reactive with human insulin were identified by ELISA. Expressed Vκ genes were cloned, sequenced, and identified using IMGT and IgBLAST as in Methods. Sequences were deposited into GenBank under accession numbers JQ915156-JQ915175. A) Bar chart summary of autoreactivity index, calculated as in Methods, of Vκ outlined in panel A. n ≥ 7 independent hybridoma isolates. Error bars encompass Vκ/Jκ heterogeneity, rather than assay heterogeneity (see panel C). (B) Autoreactivity index values are displayed for individual Vκ/Jκ species clones (represented by individual data points). Different Vκ/Jκ species harboring different CDR3 due to combinatorial and junctional diversity are indicated on X-axis. The autoreactivity index of Vκ4-57-1 sequences was compared, B6 (grey, left of bar, n = 7), NOD (white, right of bar, n = 7), p < 0.01 by Mann-Whitney U two-tailed test. The autoreactivity index of Vκ4-74 sequences was compared, B6 (grey, left of bar, n = 23), NOD (white, right of bar, n = 13), p = 0.08 by Mann-Whitney U two-tailed test. (C) CDR aa and autoreactivity index comparison of hybridoma sequences that contain the same (upper) or similar (lower) Jκ rearrangements in CDR3 isolated from VH125Tg C57BL/6 or NOD hybridomas. (D) Vκ/Jκ CDR junction and autoreactivity index comparison of hybridoma sequences isolated from VH125Tg C57BL/6 (grey) or NOD (white) mice. The autoreactivity index of P-P containing sequences (left of bar, n = 19) was compared to all other sequences (right of bar, n = 31), p < 0.001 by Mann-Whitney U two-tailed test. (E) The nt and aa sequences of Vκ4-57-1 and Vκ4-74 CDR3 are shown, along with all Jκ to indicate potential CDR3 contributions. C57BL/6 sequences are shaded grey, NOD are white. NOD nt polymorphisms and predicted aa changes (relative to C57BL/6) are underlined.
Figure 5
Figure 5. Anti-insulin Vκ are not counter-selected by central tolerance checkpoints present at the developmental transition from BM to spleen
(A) Biotin-insulin was used to identify insulin-binding B cells which were purified using flow cytometry sorting of Ag-naïve IL-7 cultured bone marrow immature B cells (B220+ IgMa+ CD23+ lymphocytes) generated as in Methods or Ag-exposed spleen B cells (B220+ IgMa+ lymphocytes) isolated ex vivo. Expressed Vκ genes were cloned, sequenced, and identified using IMGT and IgBLAST as in Methods. For each Vκ isolated, the total # of clones is shown within the pie chart, representation frequency shown outside of the pie chart border. Sequences were deposited into GenBank under the accession numbers indicated. Left, IL-7 cultured BM, n = 3 mice, n = 3 experiments, n = 15 clones, GU179059 and KC484488-KC484501. Right, Ag-experienced ex vivo spleen: n = 5 VH125Tg/NOD mice, n = 4 experiments, n = 27 clones, GU179060, KC484508-KC484536. Mice were 8–12 wk old. (B–C) Insulin-binding B cells flow cytometry sorted from VH125Tg/NOD BM and spleen (above and Fig. 2) were further separated into Low and High insulin-binding MFI populations, indicated in representative dotplots in panel B. (C) Vκ repertoire was identified in Low and High MFI populations from (B) and compared as in (A).
Figure 6
Figure 6. Anti-insulin B cells that escape central tolerance are enriched at the site of autoimmune attack
B cells whose BCR were loaded with endogenous insulin were detected by mAb123-biotin staining within B220+ IgMa+ live lymphocytes from freshly isolated pancreata of VH125Tg/NOD mice. A) Representative flow cytometry plot. B) Summary bar chart, n ≥ 8, ** p < 0.001, as calculated by a two-tailed t-test, with regard to all other groups shown.
Figure 7
Figure 7. Anti-insulin B cells that escape central tolerance undergo SHM and stimulate IFN-γ production
A) The aa CDR composition of mutated Vκ4-57-1 isolates from spleen, PLN, pancreas, and islets of VH125Tg/NOD mice is shown, germline aa are grey, mutated aa are black and underlined. B) The proportion of VH125Tg/NOD Vκ4-57-1 isolates (right) that show germline CDR (white) or mutated CDR (black) is indicated for VH125TgNOD spleen (left) and pancreas/islets (right). Germline or mutated frequency is shown outside of the pie chart border; the total number of clones is shown in the center. Sequences were deposited in GenBank with accession numbers JX064462-JX064465, JQ915176-JQ915195, and KC484502- KC484507. C) Splenocytes from VH281Tg and VH125Tg NOD mice were cultured for 72–96 h in the presence or absence of human insulin, and IFN-γ responses were measured by ELISPOT (see Methods), n ≥ 6, p > 0.01, as calculated by a two-tailed t-test.

Similar articles

Cited by

References

    1. Wardemann H, Yurasov S, Schaefer A, Young JW, Meffre E, Nussenzweig MC. Predominant autoantibody production by early human B cell precursors. Science. 2003;301:1374–1377. - PubMed
    1. Yurasov S, Wardemann H, Hammersen J, Tsuiji M, Meffre E, Pascual V, Nussenzweig MC. Defective B cell tolerance checkpoints in systemic lupus erythematosus. J Exp Med. 2005;201:703–711. - PMC - PubMed
    1. Samuels J, Ng YS, Coupillaud C, Paget D, Meffre E. Impaired early B cell tolerance in patients with rheumatoid arthritis. J Exp Med. 2005;201:1659–1667. - PMC - PubMed
    1. Menard L, Saadoun D, Isnardi I, Ng YS, Meyers G, Massad C, Price C, Abraham C, Motaghedi R, Buckner JH, Gregersen PK, Meffre E. The PTPN22 allele encoding an R620W variant interferes with the removal of developing autoreactive B cells in humans. J Clin Invest. 2011;121:3635–3644. - PMC - PubMed
    1. Halverson R, Torres RM, Pelanda R. Receptor editing is the main mechanism of B cell tolerance toward membrane antigens. Nat Immunol. 2004;5:645–650. - PubMed

Publication types

MeSH terms

Associated data