. 2013 Jun 15;190(12):6250-8.
doi: 10.4049/jimmunol.1300022. Epub 2013 May 15.

Soluble CD27-pool in humans may contribute to T cell activation and tumor immunity

Affiliations

Soluble CD27-pool in humans may contribute to T cell activation and tumor immunity

Jianping Huang et al. J Immunol. .

Abstract

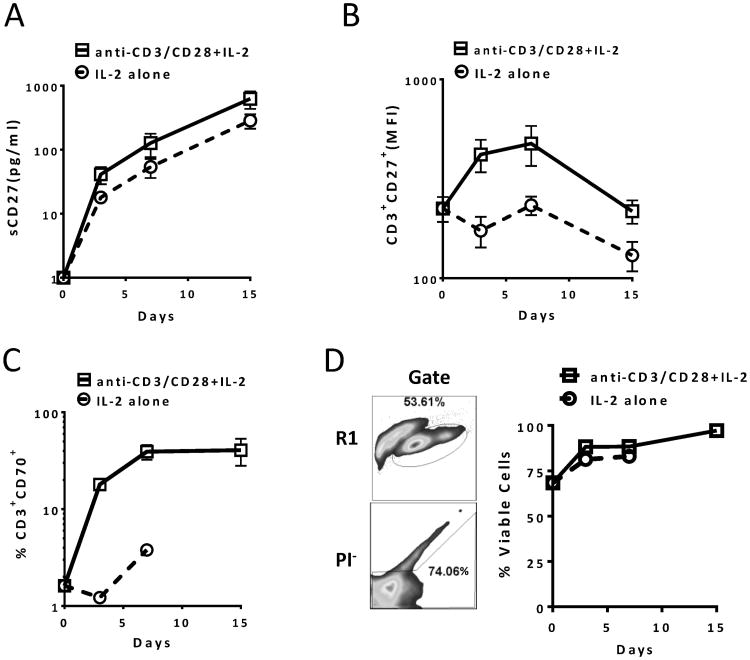
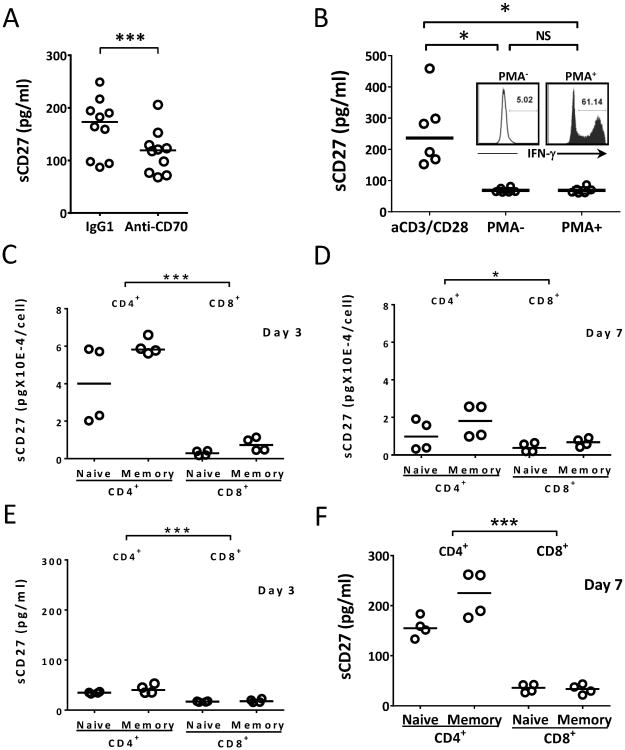
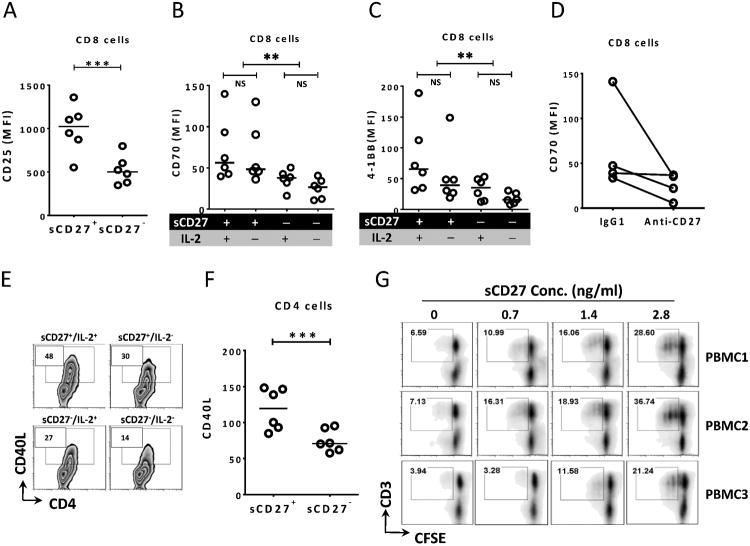
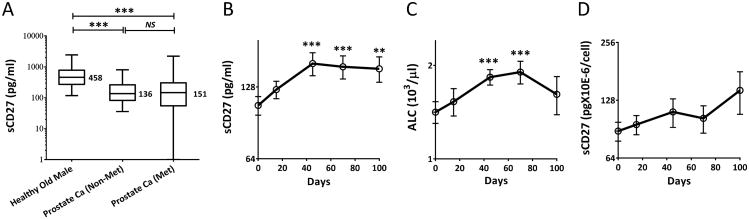
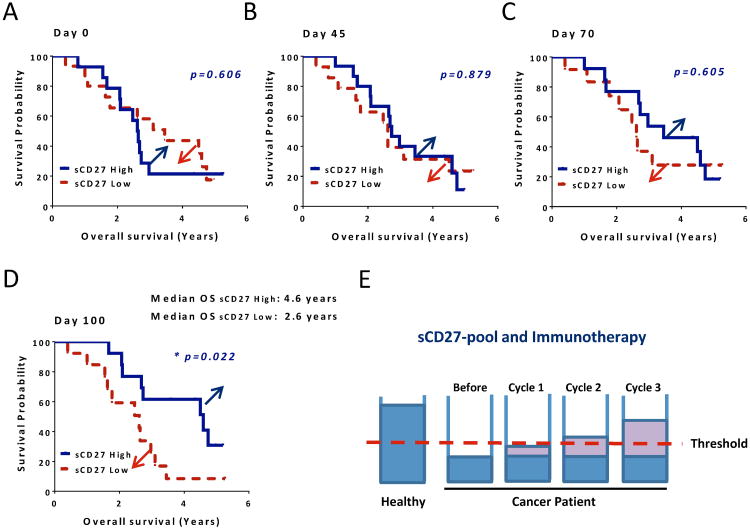
The interaction between CD27 and its ligand, CD70, has been implicated in regulating cellular immune responses to cancer. In this article, we report on the role of soluble CD27 (sCD27) in T cell activation and its elevation in the serum of cancer patients after immunotherapy. In vitro, sCD27 is preferentially derived from activated CD4(+) T cells. Adding sCD27 to stimulated PBMCs increases T cell activation and proliferation, and is associated with the immunologic synapse-related proteins myosin IIA, high mobility group box 1, and the TCR Vβ-chain. The pool of serum sCD27 is shown to be greater in healthy donors than in cancer patients. However, metastatic cancer patients treated with immunotherapy showed a significant increase in the serum sCD27-pool posttherapy (p < 0.0005); there was also an increased trend toward an association between enhanced sCD27-pool posttherapy and overall survival (p = 0.022). The identification of sCD27 as an immune modulator associated with enhanced human T cell activation in vitro and in vivo provides a rationale for developing new immunotherapeutic strategies aimed at enhancing sCD27 for treating cancer and potentially other diseases.


Conflict of interest statement

No potential conflicts of interest were disclosed.

Figures

Figure 1
Figure 1
sCD27 production is associated with T-cell activation in vitro. (A) Increased sCD27 in culture supernatant from PBMCs stimulated in vitro with anti-CD3/CD28 and IL-2. Eight PBMC samples (106 cells/ml) from healthy donors were stimulated with or without anti-CD3/CD28 beads (1:1 cell-to-bead ratio) in the presence of 10 U/ml of IL-2 for 15 days. Supernatant was collected on days 3, 7, and 15. On day 7, three of the activated PBMC samples were split and fresh medium was added due to cell overgrowth, and the dilution factor was considered when calculating the values. For day 0 sCD27 values, the analysis was done using culture medium without adding serum. The level of sCD27 was tested by ELISA, and for better data presentation, the values of sCD27 are shown in log10(y+1). A repeated measures ANOVA was performed on transformed data and orthogonal contrasts were used to test for linear trends on days 3-15 data only. (B) Expression of surface CD27 on T cells with or without stimulation. The cells described above were analyzed by FACS, and CD27 expression was measured by MFI of CD27 on CD3+ and propidium iodide negative (PI-) cell populations. The Y-axis is shown in log10(y). A repeated measures ANOVA was performed on transformed data and pair-wise p-values were adjusted using Holm's method. (C) CD70-expressing T-cell population in PBMCs with or without stimulation. FACS analysis was also done on days 0, 3, 7 and 15 for the cells described in (A) by examining the frequency of the CD3+CD70+ T-cell population in anti-CD3/CD28 and/or IL-2 stimulated PBMCs. A repeated measures ANOVA was performed on transformed data and pair-wise p-values were adjusted using Holm's method. The Y-axis is shown in log10(y). (D) No significant cell death after activation with anti-CD3/CD28 beads. The experiment described in (A) was also analyzed for viability after the activation by staining the cells with PI. An example of lymphocyte (R1) and PI negative cell gates is indicated on the left and % of PI negative cell population from 10 PBMCs is shown on the right. There were no data acquired for day 15 in the IL-2 alone group in (C) and (D). Data are presented as means ± SEM. MFI, mean fluorescence intensity.
Figure 2
Figure 2
Bypassing TCR engagement or CD70 blockage produced less sCD27; CD4+ T cells are the main source of sCD27 in vitro. (A) Blocking the interaction of CD27 with CD70 inhibited production of sCD27. Ten PBMC samples from healthy donors were stimulated with anti-CD3/CD28 beads and 20 μg/ml of IgG control or anti-CD70 antibody, and the supernatant was collected on day 4 post-stimulation. A two-way repeated measures ANOVA was performed on transformed data, by day. (B) PMA/ionomycin stimulation that bypasses TCR signaling produced minimal levels of sCD27 compared to anti-CD3/CD28 stimulation. Six PBMC samples (106 cells/ml) were incubated with or without PMA/ionomycin for 6 h. The supernatants were collected and analyzed by ELISA for sCD27 production, and T-cell activation was measured by intracellular production of IFN-γ in CD3+ T cells, as shown in the insert. For comparison, the same PBMCs were also stimulated with anti-CD3/CD28 and 10 U/ml of IL-2. After 3 days, the supernatants were collected and analyzed. A one-way repeated measures ANOVA was performed on transformed data. (C and D) CD4+ T cells appeared to produce a relatively greater amount of sCD27 per cell upon activation compared to CD8+ T cells. Four subsets of T cells (naïve CD4+, memory CD4+, naïve CD8+, and memory CD8+) were isolated from four PBMC samples using magnetic beads, and the subsets were stimulated with anti-CD3/CD28 in the presence of 10 U/ml of IL-2 for 7 days. The supernatants were collected on days 3 (panel C) and 7 (panel D) and evaluated for sCD27 by ELISA. Cell counts were also carried out. sCD27 production per cell was calculated (total amount of sCD27 divided by cell count). There was a highly significant difference between the CD4+ (naïve + memory) and CD8+ (naïve + memory) means on day 3 (p < 0.0001), and a trend of a difference on day 7 (p = 0.017). A three-factor factorial repeated measures ANOVA on the log10(y) transformed data was performed for (D) and (C). Note different scale in D. (E and F) CD4+ T cells appeared to produce a relatively greater amount of sCD27 upon activation compared to CD8+ T cells. There were highly significant differences between the CD4 and CD8 means on both days (p < 0.0001, pooled over naïve and memory cells); the difference was larger on day 7 than on day 3. Note different scale in F. The lines in the dot plots indicate the median values. *p < 0.05 (a trend); ***p < 0.001.
Figure 3
Figure 3
sCD27 up-regulates the expression of activation markers on T cells and promotes T-cell proliferation in vitro. (A) sCD27 up-regulated surface expression of the activation marker CD25 on CD8+ T cells (p < 0.0005). Six PBMC samples were stimulated with anti-CD3/CD28 beads in the presence or absence of sCD27 (1.4 ng/ml). Three days after stimulation, FACS analysis was performed by analyzing CD25 on CD8+ T cells. A one-way repeated measures ANOVA was performed on the raw data. (B and C) sCD27 also up-regulated expression of the activation markers CD70 and 4-1BB. A two-factor factorial [sCD27 (+ or −), IL-2 (+ or −)] repeated measures ANOVA on log10(y) transformed data was performed, and Holm's methods were used to adjust p-values. When the effects of sCD27 and IL-2 on CD70 and 4-1BB expression were compared, the analysis showed that sCD27 enhanced CD70 and 4-1BB expression on CD8+ T cells (p < 0.001 and p < 0.005, respectively), pooled over IL-2. (D) Depletion of sCD27 showed a trend of decrease in T-cell activation by measuring CD70 expression on CD8+ T cells. Four PBMC samples were stimulated with anti-CD3/CD28 beads in the presence of supernatant in which sCD27 was not depleted (sCD27 value = 1.4 ng/ml, IgG1) or was depleted (sCD27 value = 0 pg/ml, anti-CD27) using anti-CD27 antibody. Four days later, surface expression of CD70 on CD8+ T cells was analyzed by FACS. A one-way repeated measures ANOVA was performed on transformed data, p = 0.093. (E and F) Cells from the experiment described in (A) were also evaluated for CD40 ligand (CD40L) surface expression on CD4+ T cells by FACS analysis. sCD27 enhanced CD40L expression on CD4+ T cells measured as the percent of positive cells (panel E) or MFI (panel F). A one-way repeated measures ANOVA was performed on the raw data. (G) sCD27 promotes T-cell proliferation in vitro. Six PBMC samples from healthy donors (106 cells/ml) were labeled with CFSE and then stimulated with anti-CD3/CD28 beads at a low (1:5) bead to cell ratio in the presence of different concentrations of purified recombinant sCD27 and IL-2 (10 U/ml). The CFSE dilution was analyzed by FACS on day 5 after stimulation, and CD3+CFSE cells were gated. Results from three of six PMBC samples are shown. Lines in the dot plot graphs indicate the median values. **p < 0.01; ***p < 0.001. MFI, mean fluorescence intensity.
Figure 4
Figure 4
Serum sCD27-pools were larger in healthy donors than in cancer patients, and PROSTVAC plus ipilimumab significantly elevated the pool in these patients. (A) sCD27 levels (analyzed by ELISA) in sera from healthy donors (n = 54) were compared with pre-treatment sera from prostate cancer patients (n = 50) with rising PSA but no radiographic evidence of metastases (NCT00514072 and NCT00020254), and from patients with metastatic prostate cancer (n = 120) (NCT00060528 and NCT00113984). Healthy donors were age and gender matched with prostate cancer patients. Box-and-whisker plots are shown. The Y-axis is shown log10(y+1) and median values are indicated. Comparison was performed using one-way repeated measures ANOVA on transformed data and Holm's method was used to adjust p-values. (B) There was a significant elevation of serum sCD27-pool after administration of PROSTVAC plus ipilimumab. Pre- and post-treatment serum samples from 29 out of 30 patients enrolled in the trial were available for evaluation. sCD27 serum values were analyzed by ELISA, and comparisons were performed between mean values of each post-treatment blood draw: days 15 (n = 29), 45 (n = 29), 70 (n = 24), and 100–120 (n = 26) and the mean baseline (day 0) values for all patients. The data were calculated using the mean of four blinded tests and the Y-axis is shown in log2(y). (C) An increase in peripheral blood absolute lymphocyte count (ALC) after the treatment. Analysis similar to that described in (B) was also done for ALC. (D) Values of sCD27 in serum per lymphocyte of the patients. A calculation of sCD27 per cell at each time point of blood draw was carried out by using the total amount of sCD27 in serum of each patient divided by their ALC value on the same day. The Y-axis is shown in log2(y). For the statistical analysis, we performed a one-way repeated measures ANOVA on the transformed data. We compared the mean of the day 0 data vs. the means of the other 4 days and adjusted the p-values using Dunnett's method. **p < 0.01; ***p < 0.001. Figures show means ± SEM.
Figure 5
Figure 5
Association between elevation of sCD27-pool and clinical outcome after treatment with PROSTVAC plus ipilimumab. (A) Association between baseline CD27-pool in serum and overall survival. Separating patients into two groups, sCD27 high and sCD27 low using median values of sCD27 for day 0, Kaplan-Meier survival curves are shown for the association between sCD27 at baseline for these two groups and overall survival. (B, C and D) Association between CD27-pool enlargement in patients and overall survival after the therapy. Patients were separated into two groups: sCD27 high and sCD27 low using median increased sCD27 values (differences from day 0 baseline) for 45, 70 or 100-120 days post-treatments. The association between sCD27-pool and overall survival is shown using Kaplan-Meier survival curves, which were plotted for patients from the date of the first administration of PROSTVAC plus ipilimumab to the date of death, or the date of the last follow-up for patients who were still alive. The graphs of days 45, 70 and 100-120 after the treatment are shown. Strata were compared using the log-rank test. The values of sCD27 used for this evaluation were from an average of four blinded ELISA assays. (E) A schematic depiction of the sCD27-pool in healthy donors and cancer patients, and its elevation after immunotherapy. The level of the sCD27-pool is >3 fold higher in healthy individuals than in cancer patients before immunotherapy. After the therapy, the pool was cumulatively refilled as more treatment cycles were given, and some patients reached above a putative threshold (a red dashed line), which is the level required for proper immune function. * p = 0.022 (a trend).

Similar articles

Cited by

References

    1. Nolte MA, van Olffen RW, van Gisbergen KP, van Lier RA. Timing and tuning of CD27-CD70 interactions: the impact of signal strength in setting the balance between adaptive responses and immunopathology. Immunol Rev. 2009;229:216–231. - PubMed
    1. Lens SM, Tesselaar K, van Oers MH, van Lier RA. Control of lymphocyte function through CD27-CD70 interactions. Semin Immunol. 1998;10:491–499. - PubMed
    1. Hintzen RQ, Lens SM, Koopman G, Pals ST, Spits H, van Lier RA. CD70 represents the human ligand for CD27. Int Immunol. 1994;6:477–480. - PubMed
    1. Tesselaar K, Gravestein LA, van Schijndel GM, Borst J, van Lier RA. Characterization of murine CD70, the ligand of the TNF receptor family member CD27. J Immunol. 1997;159:4959–4965. - PubMed
    1. Tesselaar K, Xiao Y, Arens R, van Schijndel GM, Schuurhuis DH, Mebius RE, Borst J, van Lier RA. Expression of the murine CD27 ligand CD70 in vitro and in vivo. J Immunol. 2003;170:33–40. - PubMed

Publication types

MeSH terms

Substances