. 2013 Jul;70(7):394-407.
doi: 10.1002/cm.21115. Epub 2013 May 24.

An optogenetic tool for the activation of endogenous diaphanous-related formins induces thickening of stress fibers without an increase in contractility

Affiliations

An optogenetic tool for the activation of endogenous diaphanous-related formins induces thickening of stress fibers without an increase in contractility

Megha Vaman Rao et al. Cytoskeleton (Hoboken). 2013 Jul.

Abstract

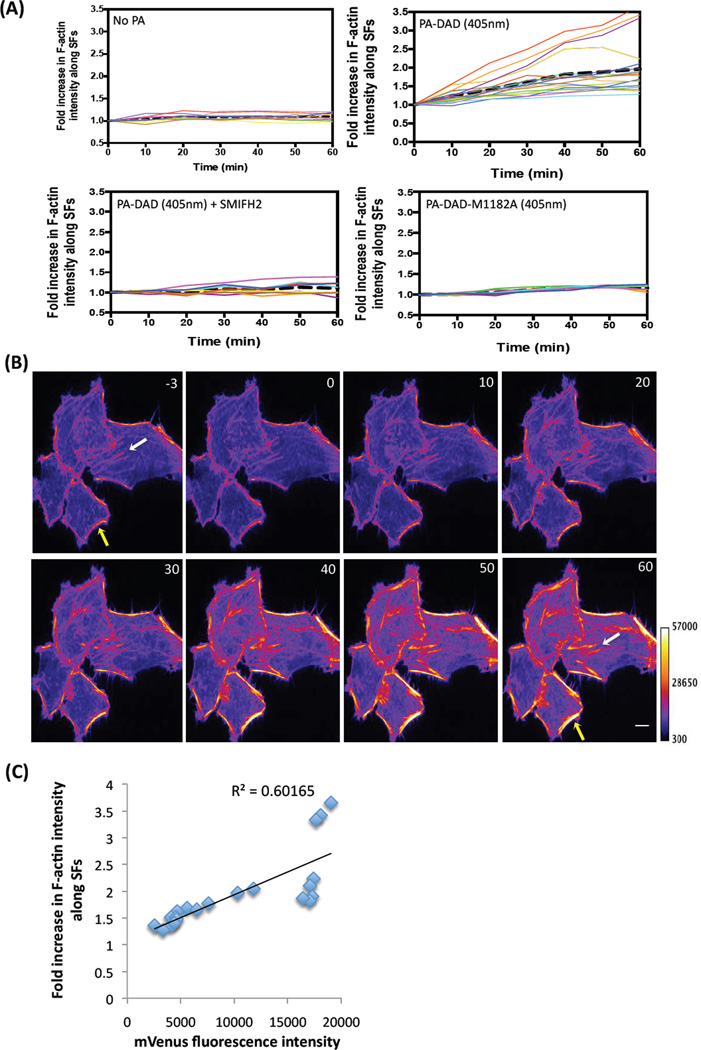
We have developed an optogenetic technique for the activation of diaphanous-related formins. Our approach is based on fusion of the light-oxygen-voltage 2 domain of Avena sativa Phototrophin1 to an isolated Diaphanous Autoregulatory Domain from mDia1. This "caged" diaphanous auto-regulatory domain was inactive in the dark but in the presence of blue light rapidly activated endogenous diaphanous-related formins. Using an F-actin reporter, we observed filopodia and lamellipodia formation as well as a steady increase in F-actin along existing stress fibers, starting within minutes of photo-activation. Interestingly, we did not observe the formation of new stress fibers. Remarkably, a 1.9-fold increase in F-actin was not paralleled by an increase in myosin II along stress fibers and the amount of tension generated by the fibers, as judged by focal adhesion size, appeared unchanged. Our results suggest a decoupling between F-actin accumulation and contractility in stress fibers and demonstrate the utility of photoactivatable diaphanous autoregulatory domain for the study of diaphanous-related formin function in cells.

Keywords: actin polymerization; actomyosin contractility; diaphanous-related formins; light-oxygen-voltage domain; optogenetics; stress fiber.


Figures

Figure 1
Figure 1. Construction and characterization of photoactivatable-DAD
(A) Cartoon representation of photo-activatable (PA-DAD) design. Exogenous, photo-activatable DAD is used to activate endogenous DRFs by releasing the intra-molecular auto-inhibition of DRFs, upon stimulation with blue light (B) Mutations introduced into the GTPase-binding domain (GBD) and Diaphanous Autoregulatory Domain (DAD) of full-length wild-type mDia1 to construct constitutively active-mDia1 (CA-mDia1) (C) Quantification and representative images of HeLa cells transfected with GFP-CA-mDia1, mVenus-DAD, mVenus-tagged LOV-DAD fusion constructs with the LOV in lit (open) and dark (closed) conformations, and with the insertion of a 6aa linker (transfected cells marked with asterisks). Cells were stained with TRITC-conjugated phalloidin to visualize actin. GFP-CA-mDia1 and mVenus-DAD were used as positive controls to demonstrate activation of endogenous Dia and production of stress fibers. Average intensity of phalloidin staining in cell body was measured for 30 cells from two separate experiments in each case. Error bars represent s.e.m. Bar, 10µm.
Figure 2
Figure 2. Effects of PA-DAD activation on the actin cytoskeleton of HeLa cells
HeLa cells transfected with mVenus-PA-DAD and the F-actin reporter F-Tractin-tdTomato were subjected to periodic photo-activation with a 405nm laser at intervals of 3 minutes (A) Quantification of increase in F-Tractin intensity at peripheral SFs during repeated photo-activation (PA). Change in intensity of individual SFs was followed by drawing polygons around them. Each colored line in the graph represents an individual SF while the black broken line indicates the average increase in intensity of several SFs analyzed (n=11 SFs for No PA, 21 SFs for PA at 405nm). Inhibition of endogenous formins using the small molecule inhibitor of formin activity, SMIFH2, abolishes the ability of PA-DAD to stimulate actin polymerization (n=9 SFs). Mutation M1182A introduced into the DAD domain of PA-DAD does not induce actin polymerization upon photo-activation (n=9 SFs). (B) Images taken from a time-lapse movie of HeLa cells transfected with mVenus-PA-DAD and F-Tractin-tdTomato. Photo-activation of PA-DAD leads to a steady increase in the intensity of both peripheral SFs (representative example marked with yellow arrow at time -3 and 60) and central SFs (white arrow in -3 and 60). Time shown in minutes. Bar, 10µm. (C) Correlation between the level of PA-DAD expression, as measured by mVenus fluorescence intensity, and the increase in F-actin along stress fibers, as measured by F-Tractin intensity.
Figure 3
Figure 3
(A) Example of a cell edge taken from a time-lapse movie showing the formation of multiple transient filopodia (arrows) following repeated photo-activation at 405nm. Time shown in minutes, 0 indicates start of photo-activation. Bar, 10µm. (B) Quantification of filopodia before and 30 minutes post-activation (n=10 cells). Error bars indicate s.e.m. (Student’s t-test, p<0.05) (C) PA-DAD activation stimulates an increase in F-Tractin intensity not only along SFs but also in the cell body, as illustrated by images taken just before and 60 minutes after photoactivation at 405nm. The boxed area within the cell illustrates the type of region used for quantification. Bar, 10µm. (D) Quantification of the increase in F-Tractin intensity in the cell body after activation of PA-DAD was done by marking a box inside the cell in an area devoid of SFs and measuring total intensity over time (n= 12 cells for No PA and 15 cells for PA at 405nm). Error bars indicate s.e.m.
Figure 4
Figure 4. F-actin polymerization along existing SF following PA-DAD activation
(A) Actin polymerization occurs all along SFs and is not necessarily initiated at FAs. Examples from four different peripheral SFs (I, II, III and IV) are shown here. Each SF was segmented into three equal parts A, B and C and change in fluorescent intensity of each segment was followed over time, as illustrated for SF-I. Yellow asterisks indicate points of anchorage of SFs at FAs in segment A and C. (B) Comparison of central and peripheral SFs (n=11 and 13 respectively) after photo-activation, showing increase in intensity of both kinds of SFs. Error bars represent s.e.m. (C) PA-DAD activation leads to actin polymerization within existing central SFs in cells, with cases of branching, divergence (white arrows) and coalescence (yellow asterisks) of SFs observed. Note that in conditions of no photo-activation (No PA), central SFs do not change during the course of imaging. Time indicated in minutes, 0 represents start of photo-activation. Bar, 10µm.
Figure 5
Figure 5. Photo-activation of PA-DAD does not lead to an increase in the size, number or intensity of FA
(A) Representative images from a time-lapse movie of paxillin-labeled focal adhesions during repeated photo-activation of PA-DAD; time indicated in minutes, 0 represents start of photo-activation. Bar, 10µm. (B) Quantification of size, number and fluorescent intensity of paxillin or zyxin-labeled focal adhesions from HeLa cells co-transfected with mVenus-PA-DAD and the respective focal adhesion marker tagged with mCherry (n>500 FAs from 7–9 cells for No PA and repeated PA conditions for both paxillin and zyxin). Error bars represent s.e.m.
Figure 6
Figure 6. Myosin recruitment into SFs is not significantly increased following PA-DAD photo-activation
(A) Quantification of GFP-tagged Myosin Regulatory Light Chain levels in SF following photoactivation of PA-DAD. (n=11 cells for No PA, 12 cells for PA at 405nm). Error bars represent s.e.m. (B) Representative images from a time-lapse movie of HeLa cells expressing phosphomimetic MRLC, mCherry-Paxillin and eBFP-PA-DAD, subjected to repeated photo-activation. Note that there is no significant change in either pMRLC or paxillin-labeled FAs. Both cells shown here express eBFP-PA-DAD. Time indicated in minutes, 0 represents start of photo-activation. Bar, 5µm. (C) Quantification of FA size and intensity in HeLa cells expressing a constitutively active form of myosin (phosphomimetic MRLC), mCherry-Paxillin and eBFP-PA-DAD, subjected to repeated photo-activation (n>500 FAs from 7 cells for no PA and with PA at 405nm). Error bars represent s.e.m.

Similar articles

Cited by

References

    1. Alberts AS. Identification of a carboxyl-terminal diaphanous-related formin homology protein autoregulatory domain. J Biol Chem. 2001;276(4):2824–2830. - PubMed
    1. Amano M, Chihara K, Kimura K, Fukata Y, Nakamura N, Matsuura Y, Kaibuchi K. Formation of actin stress fibers and focal adhesions enhanced by Rho-kinase. Science. 1997;275(5304):1308–1311. - PubMed
    1. Balaban NQ, Schwarz US, Riveline D, Goichberg P, Tzur G, Sabanay I, Mahalu D, Safran S, Bershadsky A, Addadi L, et al. Force and focal adhesion assembly: a close relationship studied using elastic micropatterned substrates. Nat Cell Biol. 2001;3(5):466–472. - PubMed
    1. Beach JR, Licate LS, Crish JF, Egelhoff TT. Analysis of the role of Ser1/Ser2/Thr9 phosphorylation on myosin II assembly and function in live cells. BMC Cell Biol. 2011;12:52. - PMC - PubMed
    1. Bershadsky AD, Ballestrem C, Carramusa L, Zilberman Y, Gilquin B, Khochbin S, Alexandrova AY, Verkhovsky AB, Shemesh T, Kozlov MM. Assembly and mechanosensory function of focal adhesions: experiments and models. Eur J Cell Biol. 2006;85(3–4):165–173. - PubMed

Publication types

LinkOut - more resources