. 2013 Jul 1;29(13):1631-7.
doi: 10.1093/bioinformatics/btt197. Epub 2013 May 14.

Updating RNA-Seq analyses after re-annotation

Affiliations

Updating RNA-Seq analyses after re-annotation

Adam Roberts et al. Bioinformatics. .

Abstract

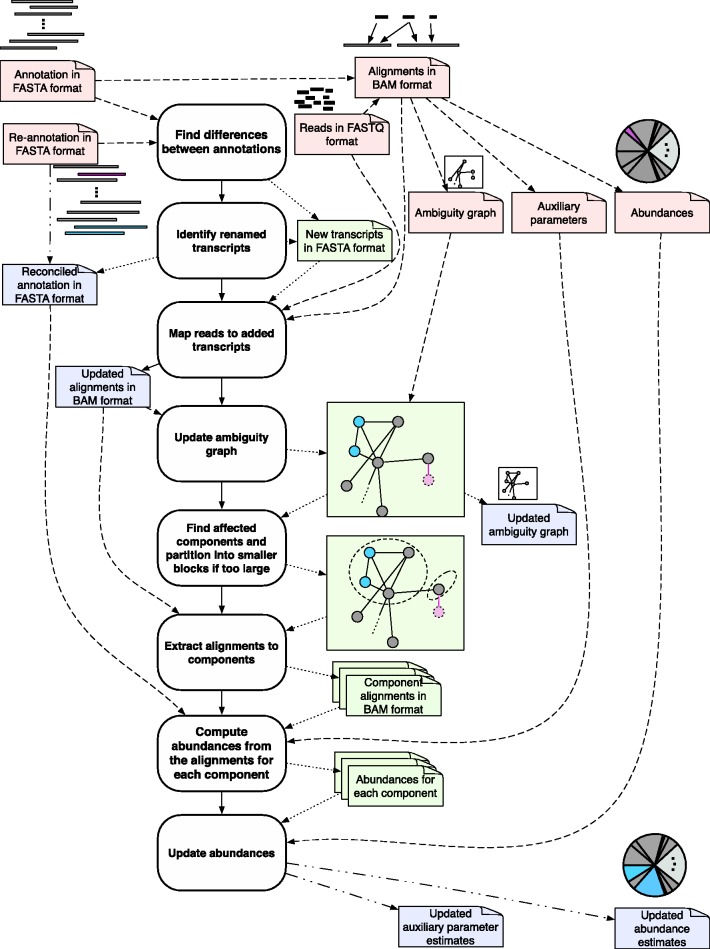
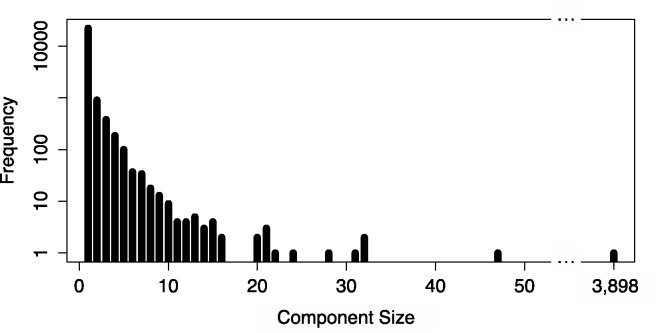
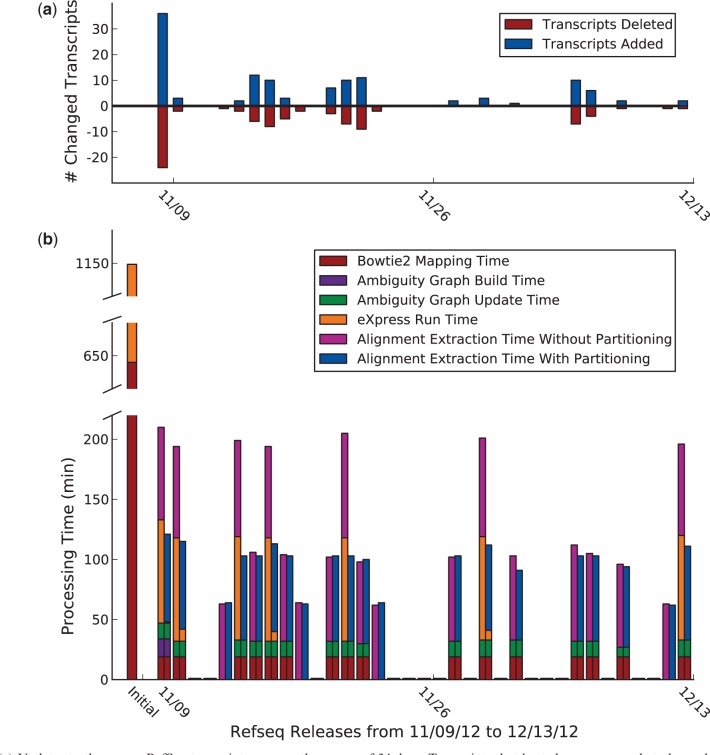
The estimation of isoform abundances from RNA-Seq data requires a time-intensive step of mapping reads to either an assembled or previously annotated transcriptome, followed by an optimization procedure for deconvolution of multi-mapping reads. These procedures are essential for downstream analysis such as differential expression. In cases where it is desirable to adjust the underlying annotation, for example, on the discovery of novel isoforms or errors in existing annotations, current pipelines must be rerun from scratch. This makes it difficult to update abundance estimates after re-annotation, or to explore the effect of changes in the transcriptome on analyses. We present a novel efficient algorithm for updating abundance estimates from RNA-Seq experiments on re-annotation that does not require re-analysis of the entire dataset. Our approach is based on a fast partitioning algorithm for identifying transcripts whose abundances may depend on the added or deleted isoforms, and on a fast follow-up approach to re-estimating abundances for all transcripts. We demonstrate the effectiveness of our methods by showing how to synchronize RNA-Seq abundance estimates with the daily RefSeq incremental updates. Thus, we provide a practical approach to maintaining relevant databases of RNA-Seq derived abundance estimates even as annotations are being constantly revised.

Availability and implementation: Our methods are implemented in software called ReXpress and are freely available, together with source code, at http://bio.math.berkeley.edu/ReXpress/.

Supplementary information: Supplementary data are available at Bioinformatics online.


Figures

Fig. 1.
Fig. 1.
Overview of the approach: Reads are initially aligned to a set of known transcript sequences and these alignments are used to probabilistically assign multi-mapping reads and to estimate abundances of the transcripts. The result is a set of relative abundances, for example, in fragments per kilobase per million mapped (FPKM) units. When a new annotation is given, differences are identified. Reads are mapped to any added transcripts, and the ambiguity graph, where vertices correspond to transcripts and edges correspond to pairs of transcripts to which reads have mapped ambiguously, is updated (deleted transcripts in red and added transcripts in blue). The ‘affected’ transcripts whose abundance must be re-computed are obtained from a partitioning in the graph. Finally, the subset of affected transcripts have their abundances re-computed using the relevant reads, and abundances for the transcriptome are re-computed
Fig. 2.
Fig. 2.
The distribution of component sizes in the ambiguity graph for the 60 hour time point in (Trapnell et al., 2010) using ∼30 million mapped 75 bp paired-end reads. The largest component (shown in Supplementary Fig. S1) exhibits substantial structure and the existence of many small clusters within it is the reason for the effectiveness of the partitioning algorithm we describe to reduce the complexity of the update algorithm
Fig. 3.
Fig. 3.
(a) Updates to the mouse RefSeq transcriptome over the course of 34 days. Transcripts that kept the same name but changed sequence were treated as an addition and a deletion. (b) ReXpress run time, in minutes, on each RefSeq update, with and without partitioning. Initial run time consists of Bowtie2 alignment time (24 cores) and eXpress abundance estimation time (3 cores), without ReXpress. Partitioning was done when a changed transcript was part of a component larger than 300 transcripts, which occurred seven times over the 34-day period

Similar articles

Cited by

References

    1. Asmann YW, et al. Detection of redundant fusion transcripts as biomarkers or disease-specific therapeutic targets in breast cancer. Cancer Res. 2012;72:1921–1928. - PubMed
    1. Bichot CE, Siarry P, editors. Graph Partitioning. Hoboken, NJ, USA: Wiley; 2011.
    1. Graveley BR, et al. The developmental transcriptome of Drosophila melanogaster. Nature. 2010;471:473–479. - PMC - PubMed
    1. Langmead B, Salzberg SL. Fast gapped-read alignment with Bowtie2. Nat. Methods. 2012;9:357–359. - PMC - PubMed
    1. Li B, Dewey C. RSEM: accurate transcript quantification from RNA-Seq data with or without a reference genome. BMC Bioinformatics. 2011;12:323. - PMC - PubMed

Publication types

LinkOut - more resources