. 2013 Jun 28;288(26):19103-15.
doi: 10.1074/jbc.M112.434530. Epub 2013 May 15.

Deregulation of apoptotic factors Bcl-xL and Bax confers apoptotic resistance to myeloid-derived suppressor cells and contributes to their persistence in cancer

Affiliations

Deregulation of apoptotic factors Bcl-xL and Bax confers apoptotic resistance to myeloid-derived suppressor cells and contributes to their persistence in cancer

Xiaolin Hu et al. J Biol Chem. .

Abstract

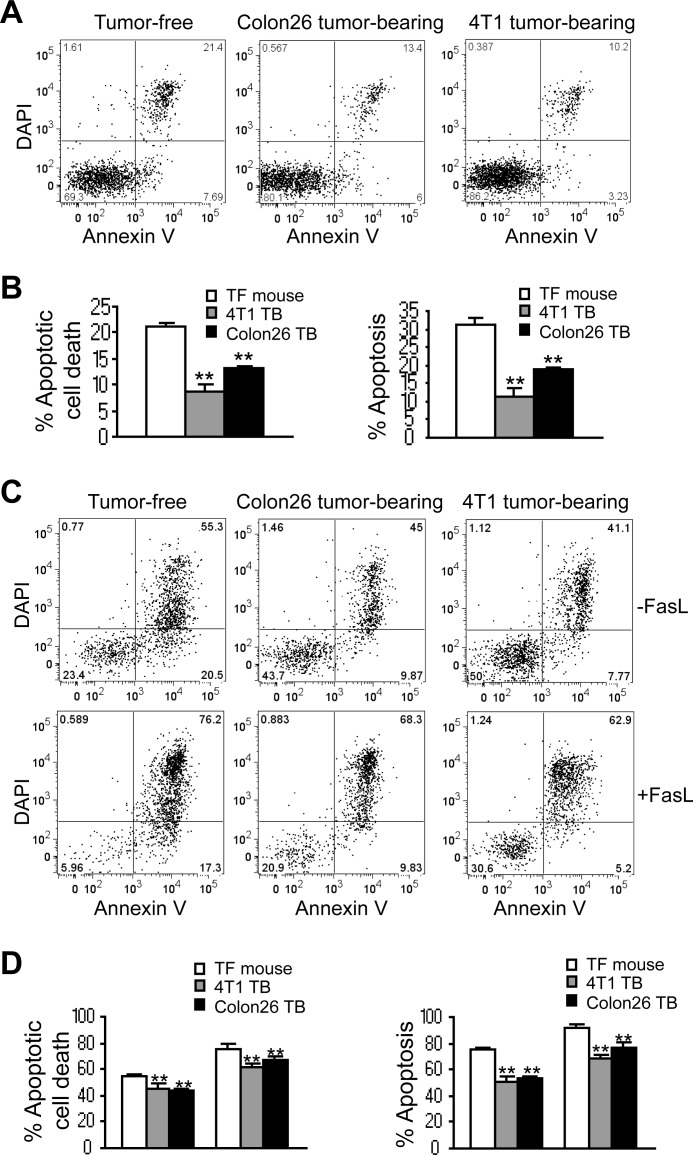
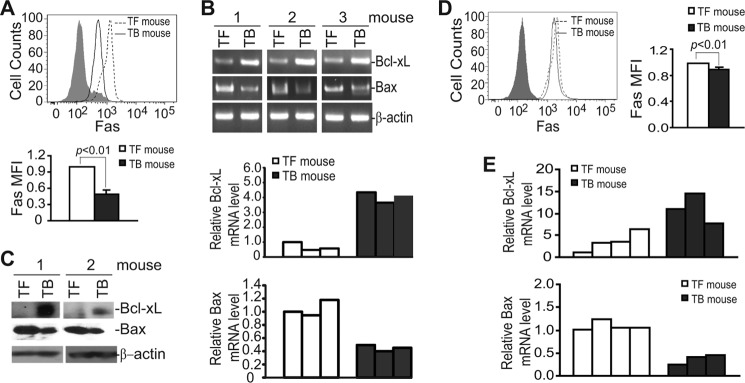
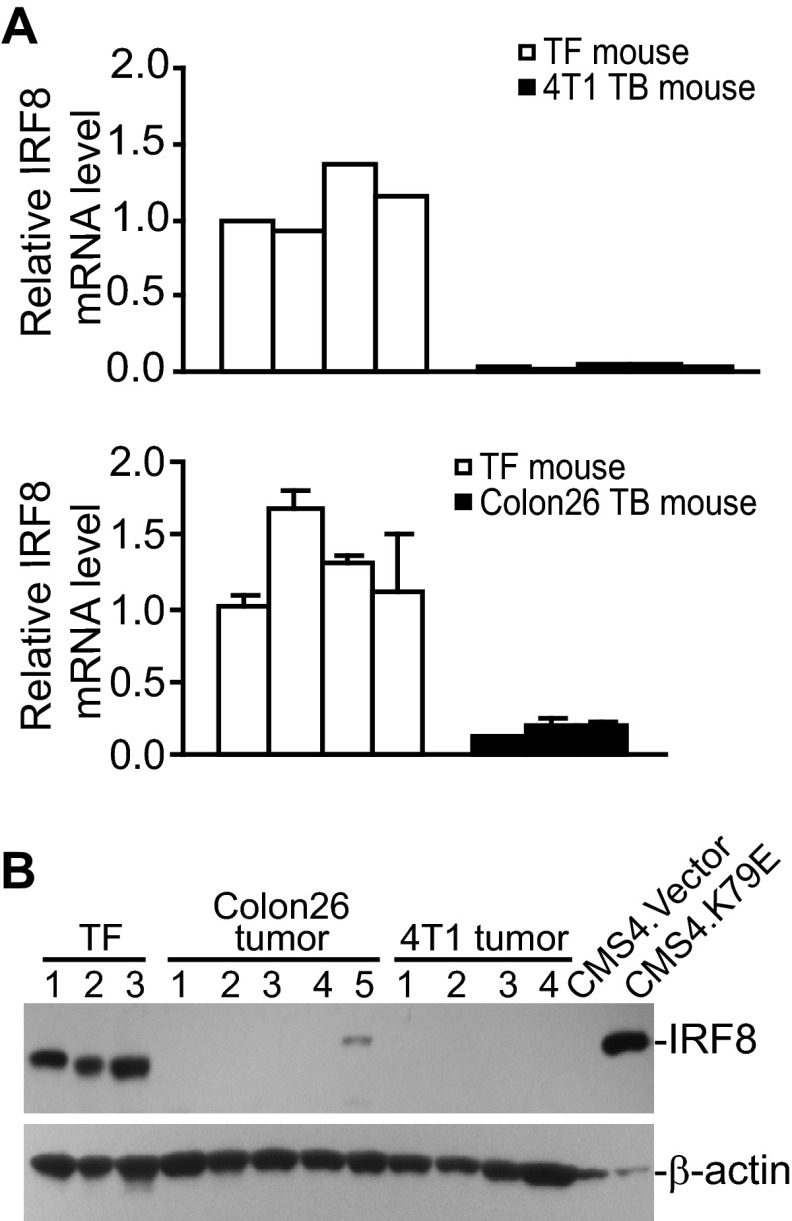
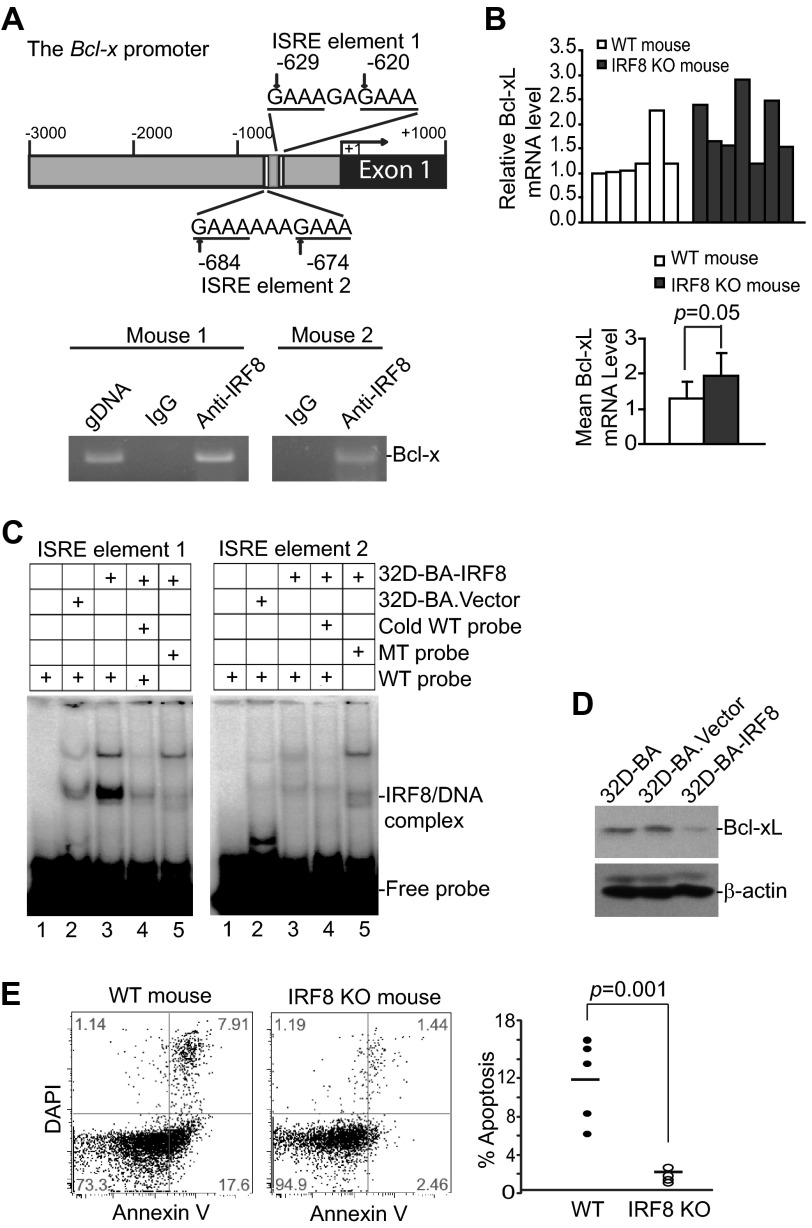
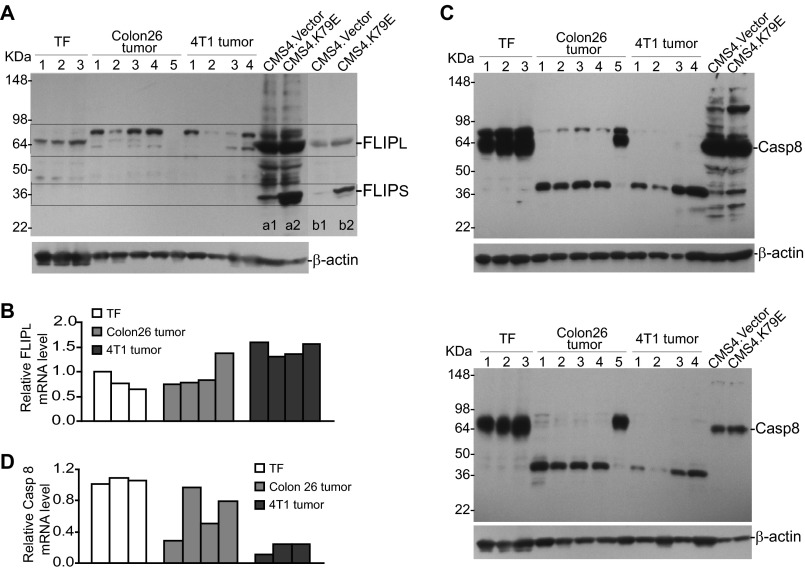
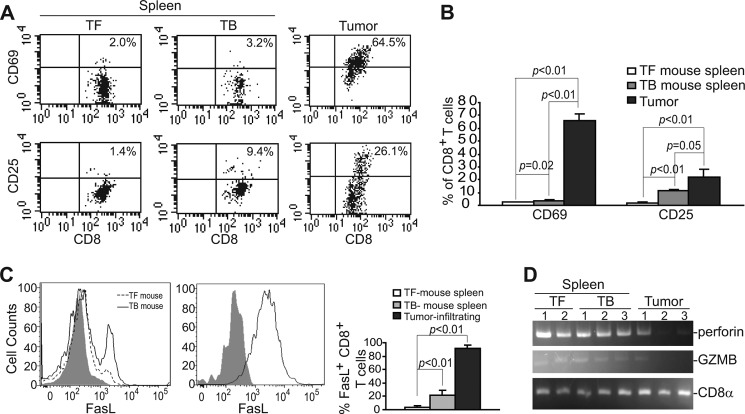
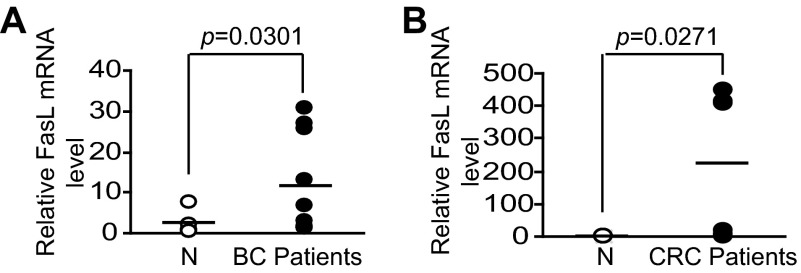
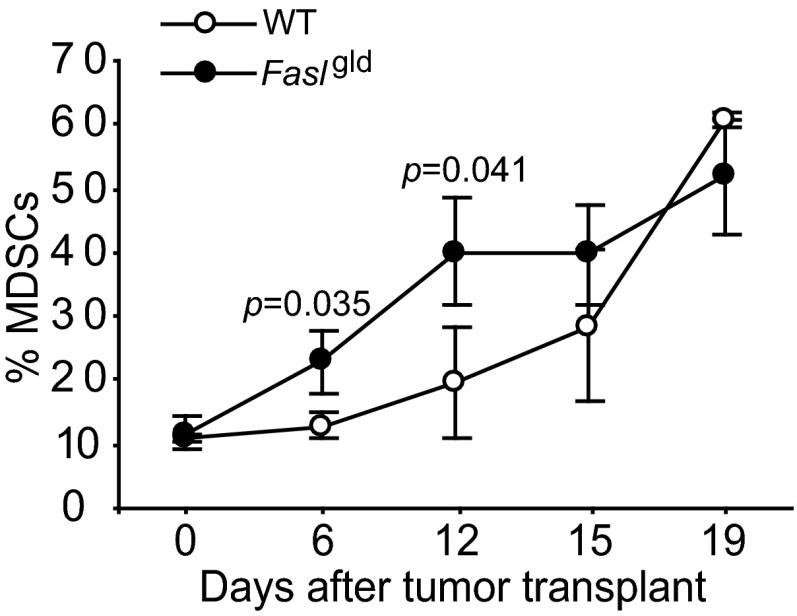
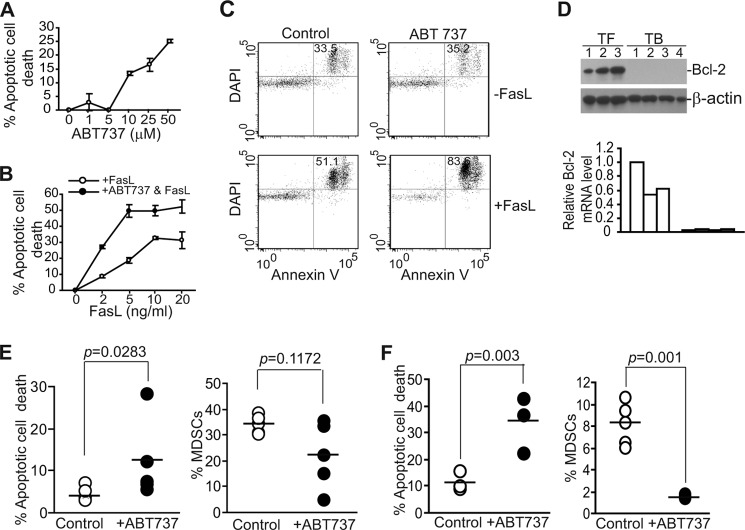
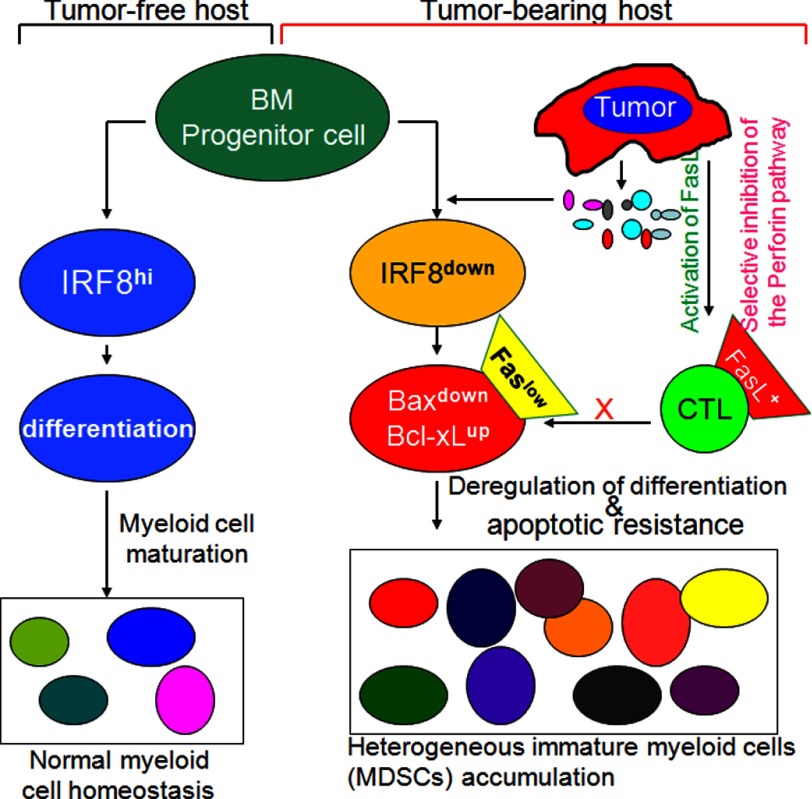
Myeloid-derived suppressor cells (MDSCs) are heterogeneous immature myeloid cells that accumulate in response to tumor progression. Compelling data from mouse models and human cancer patients showed that tumor-induced inflammatory mediators induce MDSC differentiation. However, the mechanisms underlying MDSC persistence is largely unknown. Here, we demonstrated that tumor-induced MDSCs exhibit significantly decreased spontaneous apoptosis as compared with myeloid cells with the same phenotypes from tumor-free mice. Consistent with the decreased apoptosis, cell surface Fas receptor decreased significantly in tumor-induced MDSCs. Screening for changes of key apoptosis mediators downstream the Fas receptor revealed that expression levels of IRF8 and Bax are diminished, whereas expression of Bcl-xL is increased in tumor-induced MDSCs. We further determined that IRF8 binds directly to Bax and Bcl-x promoter in primary myeloid cells in vivo, and IRF8-deficient MDSC-like cells also exhibit increased Bcl-xL and decreased Bax expression. Analysis of CD69 and CD25 levels revealed that cytotoxic T lymphocytes (CTLs) are partially activated in tumor-bearing hosts. Strikingly, FasL but not perforin and granzymes were selectively activated in CTLs in the tumor-bearing host. ABT-737 significantly increased the sensitivity of MDSCs to Fas-mediated apoptosis in vitro. More importantly, ABT-737 therapy increased MDSC spontaneous apoptosis and decreased MDSC accumulation in tumor-bearing mice. Our data thus determined that MDSCs use down-regulation of IRF8 to alter Bax and Bcl-xL expression to deregulate the Fas-mediated apoptosis pathway to evade elimination by host CTLs. Therefore, targeting Bcl-xL is potentially effective in suppression of MDSC persistence in cancer therapy.

Keywords: Apoptosis; Bax; Bcl-2 Family; Fas; Myeloid Cell.


Figures

FIGURE 1.
FIGURE 1.
Tumor-induced MDSCs exhibit decreased spontaneous apoptosis in vivo. A and B, colon carcinoma Colon26 cells were surgically transplanted to the cecal wall of BALB/c mice to establish an orthotopic colon cancer mouse model. Mammary carcinoma 4T1 cells were injected to mammary fat pads of BALB/c mice to establish an orthotopic breast cancer mouse model. Spleen cells from tumor-free control mice (n = 5) and from tumor-bearing mice (n = 5 for each mouse model) were collected ∼30 days after tumor transplant and stained immediately under cold conditions with CD11b-, Gr1-specific mAbs, plus annexin V and DAPI. Stained live cells were analyzed immediately by flow cytometry. CD11b+Gr1+ cells were gated and analyzed for annexin V+ and DAPI+ cells. Shown are representative results of one of five mice for each tumor model. B, % apoptotic cell death was calculated as % CD11b+Gr1+annexinV+DAPI+ cells. % Apoptosis was quantified as % CD11b+Gr1+anexinV+ cells. Column, mean; bar, S.D. C and D, total spleen cells as described in A were cultured in the absence or presence of FasL in a 37 °C CO2 incubator for ∼24 h and analyzed for apoptosis as shown in A. D, quantification of apoptosis as shown in C.
FIGURE 2.
FIGURE 2.
Deregulation of Fas, Bax, and Bcl-xL in MDSCs in tumor-bearing mice. A, cell surface Fas protein levels in 4T1 tumor-bearing mice are shown. Spleen cells were collected from tumor-free control (TF) and 4T1 tumor-bearing (TB) mice and stained with CD11b-, Gr1-, and Fas-specific mAbs. The stained cells were then analyzed for Fas protein level in gated CD11b+Gr1+ cells by flow cytometry. Shown is the representative image of one of three pairs of mice. The Fas mean fluorescence intensity (MFI) was then quantified and presented at the bottom panel. Column, mean; bar, S.D. B, expression levels of Bcl-xL and Bax in MDSCs from 4T1 tumor-bearing mice are shown. MDSCs were purified from tumor-free (n = 3) and tumor-bearing (n = 3) mice. The expression levels of the indicated genes were analyzed by semi-quantitative RT-PCR (top panel) and real-time PCR (bottom panel). β-Actin was used as the normalization control in the real-time PCR. C, Bcl-xL and Bax protein levels in MDSCs from 4T1 tumor-bearing mice were analyzed by Western blotting. D, cell surface Fas protein levels in Colon26 tumor-bearing mice are shown. Spleen cells were collected from tumor-free control (TF) and Colon26 tumor-bearing (TB) mice and analyzed as in A. Shown is the representative image of one of three pairs of mice. The Fas mean fluorescence intensity was then quantified and presented at the right panel. Column, mean; bar, S.D. E, shown is quantitative analysis of Bcl-xL and Bax expression level in MDSCs. MDSCs were purified from tumor-free (n = 4) and Colon26 tumor-bearing (n = 3) mice. The mRNA levels of Bcl-xL and Bax were analyzed by real-time RT-PCR with β-actin as normalization controls.
FIGURE 3.
FIGURE 3.
IRF8 Expression is silenced in tumor-induced MDSCs in vivo. A, IRF8 expression levels in MDSCs from 4T1 tumor (top panel)- and Colon26 tumor (bottom panel)-bearing mice are shown. MDSCs were purified from tumor-free control (TF, n = 4 for each tumor model), 4T1 tumor-bearing (TB, n = 5), and Colon26 tumor-bearing (TB, n = 3) mice and analyzed by real-time RT-PCR for IRF8 mRNA levels with β-actin as normalization controls. B, MDSCs from tumor-free, Colon26 tumor-bearing (n = 5), and 4T1 tumor-bearing (n = 4) mice were also analyzed by Western blotting for IRF8 protein levels. CMS4.Vector and CMS4.K79E cells were used here as IRF8 protein controls.
FIGURE 4.
FIGURE 4.
IRF8 is a transcriptional repressor of Bcl-xL. A, IRF8 binds to the Bcl-x promoter in primary myeloid cells. Top panel, shown is the mouse Bcl-x gene promoter structure. The locations of two ISRE elements are indicated. Bottom panel, ChIP analysis of IRF8 binding to the Bcl-x promoter in CD11b+ myeloid cells is shown. Genomic DNA was used as a positive control for PCR. B, analysis of mouse Bcl-xL mRNA levels in CD11b+ myeloid cells from wild type (n = 6) and IRF8 KO mice (n = 7) is shown by real-time RT-PCR. β-Actin was used as the normalization control. The relative Bcl-xL mRNA levels in WT and IRF8 KO mice were averaged and are presented in the bottom panel. C, DNA probes that contain ISRE sequences as shown in A were incubated with nuclear extracts from 32D-BA.Vector and 32D-BA.IRF8 cells as indicated. Mutant probes and cold probe competition were included as specificity controls. The protein-DNA complexes were analyzed by non-denatured polyacrylamide gel. D, the indicated myeloid cells were analyzed for Bcl-xL protein levels by Western blotting analysis. E, shown is spontaneous apoptosis of spleen cells in WT and IRF8 KO mice. Spleen cells were stained with CD11b- and Gr1-specific mAb plus annexin V and DAPI and analyzed by flow cytometry. Shown are representative images of one pair of five pairs of mice (left two panels). Apoptosis was quantified in gated MDSCs as % annexin V+ DAPI+ cells and is presented in the right panel. Each dot represents % apoptosis of MDSCs from one mouse.
FIGURE 5.
FIGURE 5.
FLIP and caspase 8 expression levels in tumor-induced MDSCs. A, MDSCs were purified from spleen cells of tumor-free (TF; n = 3), Colon26 tumor-bearing (n = 5), and 4T1 tumor-bearing (n = 4) mice and analyzed for FLIP protein levels. CMS4.Vector and CMS4.K79E cells were used here as FLIP protein-positive controls. Lanes b1 and b2 are lighter exposed images of lanes a1 and a2. The locations of FLIPs and FLIPL are indicated based on the positive controls. B, MDSCs were purified from the spleens of the indicated mice as in A and analyzed for FLIPL mRNA levels by real-time RT-PCR. β-Actin was used as the normalization control. C, MDSCs were purified as in A and analyzed for caspase 8 protein levels using a rabbit anti-mouse caspase 8 antibody (AF1650, top panel) and a goat anti-mouse caspase 8 (AF705, bottom panel) antibody, respectively. CMS4.Vector and CMS4.K79E cells were used as Casp8 protein positive controls. D, MDSCs were purified from the spleens of the indicated mice as in A and analyzed for caspase 8 mRNA levels by real-time RT-PCR with β-actin as normalization controls.
FIGURE 6.
FIGURE 6.
FasL is up-regulated in tumor-infiltrating CTLs. A, shown is the activation status of CTLs. Spleen cells from tumor-free (TF, n = 3) and 4T1 tumor-bearing (TB, n = 3) mice and tumors were stained for CD25 and CD69 levels on CTLs by flow cytometry. CD8+ T cells were gated and analyzed for CD25 and CD69. Shown are representative images of one of three mice. B, the percentage of CD25+/CD69+ CD8+ T cells as shown in A was quantified and presented. C, spleen cells from tumor-free control (n = 3) and 4T1 tumor-bearing (n = 3) mice and tumors were stained with CD8- and FasL-specific mAbs. CD8+ cells were then gated and analyzed for FasL+ cells by flow cytometry. The percentage of FasL+ CD8+ T cells were quantified and presented in the right panel. D, shown is activation status of the perforin cytotoxic pathway. CD8+ T cells were isolated from spleen cells of tumor-free and 4T1 tumor-bearing mice and tumors and analyzed for the expression levels of perforin and granzyme B (GZMB) by RT-PCR. CD8α was used as normalization control.
FIGURE 7.
FIGURE 7.
FasL expression is up-regulated in CTLs of human cancer patients. Peripheral blood was collected from normal donors (N), human breast (BC patients, A), and colorectal (CRC patients, B) cancer patients. CD8+ T cells were isolated for RNA preparation. FasL mRNA levels were analyzed by real-time RT-PCR using CD8a as normalization controls.
FIGURE 8.
FIGURE 8.
Fas-FasL interaction mediates MDSCs homeostasis. 4T1 tumor cells were injected to WT control (n = 3) and Faslgld (n = 3) mice. Blood was collected at the indicated time points and analyzed for CD11b+Gr1+ MDSCs over time.
FIGURE 9.
FIGURE 9.
Pharmacologic inhibition of Bcl-xL activity increases spontaneous MDSC apoptosis to suppress MDSC accumulation in vivo. A, ABT-737 cytotoxicity to MDSCs is shown. Total spleen cells were cultured in the presence of different doses of ABT-737 for ∼16 h. Cells were then stained with CD11b- and Gr1-specific mAbs plus annexin V. CD11b+Gr1+ cells were gated and analyzed for annexin V+ cells. % apoptosis was calculated by the formula: % CD11b+Gr1+annexinV+ cells in the presence of ABT-737 − % CD11b+Gr1+annexinV+ cells in the absence of ABT-737. B, total spleen cells were cultured in the absence or presence of a sublethal dose of ABT737 (5 μm) and various concentrations of FasL as indicated for ∼16 h and analyzed for apoptosis as in A. Shown are representative results of one of two independent experiments. C, a sublethal dose of ABT-737 increased MDSC sensitivity to Fas-mediated apoptosis. Total spleen cells were cultured in the absence or presence of a sublethal dose of ABT737 (5 μm) and FasL (10 ng/ml) for ∼16 h and analyzed for apoptosis as in B. Shown are representative plots of one of two independent experiments. D, shown are Bcl-2 expression levels in MDSCs. MDSCs were purified from tumor-free (TF, n = 3) and 4T1 tumor-bearing (TB, n = 4) mice and analyzed for Bcl-2 protein level by Western blotting. E, ABT-737 increased MDSC spontaneous apoptosis and decreased MDSC accumulation in 4T1 tumor-bearing mice. 4T1 cells were injected to mouse mammary pat pad. Tumor-bearing mice were either untreated (n = 5) or treated with ABT737 (n = 5) injected intravenously as described under “Materials and Methods.” Spleen cells from untreated and treated mice were analyzed for CD11b+Gr1+annexin V+DAPI+ cells (left panel) and % MDSCs of total spleen cells (right panel). Each dot represents % apoptotic MDSCs (left panel) or % total MDSCs (right panel) of one mouse. F, ABT-737 increased MDSC spontaneous apoptosis and decreased MDSC accumulation in Colon26 tumor-bearing mice. Colon26 cells were injected to mice subcutaneously. Tumor-bearing mice were either untreated (n = 5) or treated with ABT737 (n = 3) injected intravenously as described under “Materials and Methods.” Spleen cells from untreated and treated mice were analyzed for CD11b+Gr1+annexin V+DAPI+ cells (left panel) and % MDSCs of total spleen cells (right panel). Each dot represents % apoptotic MDSCs (left panel) or % MDSCs (right panel) of one mouse.
FIGURE 10.
FIGURE 10.
Model of apoptotic resistance and MDSC persistence in vivo. IRF8 is highly expressed in myeloid progenitor cells from the bone marrow (BM) to regulate myeloid cell differentiation. Tumor cells secrete inflammatory mediators to decrease IRF8 expression. Loss of IRF8 expression results in blockage of normal myeloid cell differentiation and altered Bax and Bcl-xL expression in the immature myeloid cells to confer MDSCs with increased resistance to Fas-mediated apoptosis, resulting in escape of MDSCs from CTL-mediated and FasL-dependent elimination to persist.

Similar articles

Cited by

References

    1. Ostrand-Rosenberg S. (2010) Myeloid-derived suppressor cells. More mechanisms for inhibiting antitumor immunity. Cancer Immunol. Immunother. 59, 1593–1600 - PMC - PubMed
    1. Gabrilovich D. I., Ostrand-Rosenberg S., Bronte V. (2012) Coordinated regulation of myeloid cells by tumours. Nat. Rev. Immunol. 12, 253–268 - PMC - PubMed
    1. Srivastava M. K., Andersson Å., Zhu L., Harris-White M., Lee J. M., Dubinett S., Sharma S. (2012) Myeloid suppressor cells and immune modulation in lung cancer. Immunotherapy 4, 291–304 - PMC - PubMed
    1. Saleem S. J., Martin R. K., Morales J. K., Sturgill J. L., Gibb D. R., Graham L., Bear H. D., Manjili M. H., Ryan J. J., Conrad D. H. (2012) Cutting edge. Mast cells critically augment myeloid-derived suppressor cell activity. J. Immunol. 189, 511–515 - PMC - PubMed
    1. Haile L. A., Gamrekelashvili J., Manns M. P., Korangy F., Greten T. F. (2010) CD49d is a new marker for distinct myeloid-derived suppressor cell subpopulations in mice. J. Immunol. 185, 203–210 - PubMed

Publication types