. 2013 Sep;110(5):1070-86.
doi: 10.1152/jn.00911.2012. Epub 2013 May 15.

Phase shift in the 24-hour rhythm of hippocampal EEG spiking activity in a rat model of temporal lobe epilepsy

Affiliations

Phase shift in the 24-hour rhythm of hippocampal EEG spiking activity in a rat model of temporal lobe epilepsy

David A Stanley et al. J Neurophysiol. 2013 Sep.

Abstract

For over a century epileptic seizures have been known to cluster at specific times of the day. Recent studies have suggested that the circadian regulatory system may become permanently altered in epilepsy, but little is known about how this affects neural activity and the daily pattern of seizures. To investigate, we tracked long-term changes in the rate of spontaneous hippocampal EEG spikes (SPKs) in a rat model of temporal lobe epilepsy. In healthy animals, SPKs oscillated with near 24-h period; however, after injury by status epilepticus, a persistent phase shift of ∼12 h emerged in animals that later went on to develop chronic spontaneous seizures. Additional measurements showed that global 24-h rhythms, including core body temperature and theta state transitions, did not phase shift. Instead, we hypothesized that locally impaired circadian input to the hippocampus might be responsible for the SPK phase shift. This was investigated with a biophysical computer model in which we showed that subtle changes in the relative strengths of circadian input could produce a phase shift in hippocampal neural activity. MRI provided evidence that the medial septum, a putative circadian relay center for the hippocampus, exhibits signs of damage and therefore could contribute to local circadian impairment. Our results suggest that balanced circadian input is critical to maintaining natural circadian phase in the hippocampus and that damage to circadian relay centers, such as the medial septum, may disrupt this balance. We conclude by discussing how abnormal circadian regulation may contribute to the daily rhythms of epileptic seizures and related cognitive dysfunction.

Keywords: MRI; circadian input; epilepsy; hippocampus; in vivo; mathematical model; medial septum; sharp wave; status epilepticus.


Figures
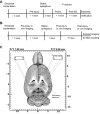
Fig. 1.
Fig. 1.
Experimental setup for chronic in vivo studies. A: experimental timeline for EEG and core body temperature (CBT) recordings. For EEG, data were split into preinjury (Pre), postinjury latency (Post-L), and postinjury spontaneously seizing (Post-SS) stages. The beginning of the Post-SS stage was defined as following the first spontaneous grade 3 or greater seizure. B: experimental timeline for rat MRI. C: placement of stimulating and recording electrodes. Channel number 2, corresponding to the ipsilateral CA1 region, was used for EEG analysis in this study.
Fig. 2.
Fig. 2.
EEG spike (SPK) shape profiles. A: thin lines denote single SPKs, and thick lines denote the mean shape profile as taken from the Pre, Post-L, and Post-SS stages of epileptogenesis. B: collection of 200 randomly selected SPKs from a 24-h interval superimposed over the mean shape profile for the 3 stages of epileptogenesis.
Fig. 3.
Fig. 3.
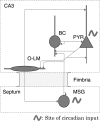
Network connectivity in the neural network model. Sites of circadian input to region CA3 and to the medial septum are indicated by ∼. Additionally, all GABAergic synapses are subject to circadian modulation by melatonin. BC, basket cells; MSG, medial septal GABAergic interneurons; O-LM, stratum oriens interneurons projecting into lacunosum moleculare; PYR, pyramidal neurons.
Fig. 4.
Fig. 4.
Phase shift in the 24-h rhythm of spontaneous hippocampal SPKs. A and B: chronic tracking of SPK rates for Pre, Post-L, and Post-SS stages of epileptogenesis for a single rat. Days are marked from the start of preinjury recording in A and from the day of status epilepticus (SE) in B. Dot-dashed vertical lines correspond to 0000 (midnight). The gaps in the traces reflect data missing because of technical problems. C: the baseline drift in SPK rate was subtracted out, and the resulting detrended time series was combined into a 24-h time window (modulo 24). This was done for Pre, Post-L, and Post-SS stages of epileptogenesis. Cosine fits (gray) reveal a postinjury phase shift. D: estimating the average time of minimum SPK activity across all animals showed a statistically significant phase shift during Post-L and Post-SS stages. The time of minimum SPK activity was measured to avoid the discontinuity between 2359 and 0000. E: SPK rates from a rat that was stimulated into SE but did not successfully develop spontaneous seizures after 4 wk of monitoring. Preinjury (Pre) and postinjury (Post) stages are shown. Cosine fits (gray) show a slight drift in phase following injury. F: for animals that did not develop spontaneous seizures, the postinjury phase shift did not reach significance. Values are means ± SE. *P < 0.05 by t-test.
Fig. 5.
Fig. 5.
Circadian phase of CBT is unperturbed after injury. A and B: tracking of 24-h rhythms of CBT is shown for a single spontaneously seizing rat before and after injury, respectively. Days are marked from the start of preinjury recording in A and from the day of SE in B. Note that since CBT recordings did not include simultaneous EEG because of interference from the transponder, we did not attempt to split postinjury data into latency and spontaneously seizing stages. C: data were compressed into single 24-h time windows as in previous figures. There was no observed phase shift after injury, although the variability of the signal did increase. D: the lack of phase shift in CBT activity after injury was consistent across rats examined. The time of minimum CBT activity was measured to avoid the discontinuity between 2359 and 0000. Values are means ± SE.
Fig. 6.
Fig. 6.
Interaction of SPKs with the 24-h rhythm of theta activity cannot explain SPK phase shift. A and B: extracted 2-s epochs of theta activity and non-theta, respectively. SPK event is indicated by arrow. Ratio of theta to delta power is 3.28 in theta (A) and 0.09 in non-theta (B). C and D: fraction of time spent in theta state for Pre, Post-L, and Post-SS stages of epileptogenesis for a single rat. Days are marked from the start of preinjury recording in C and from the day of SE in D. The gaps in the traces reflect data missing because of technical problems. E: the baseline drift in theta activity was subtracted from the data shown in C and D, and the resulting detrended time series was compressed into a 24-h time window. The theta activity trends show a 24-h rhythm that does not shift phase between Pre, Post-L, and Post-SS stages. Cosine fits are indicated by solid lines. F: examining the time of minimum theta activity across all rats showed that there was no significant change in the theta rhythm's 24-h oscillation. G: examination of SPKs exclusively in the non-theta state allowed for tracking of SPK rates independent of transitions between theta and non-theta states. As before, a phase shift was observed after injury. H: this analysis was repeated for all rats, and we observed a statistically significant phase shift between the preinjury and postinjury stages of epileptogenesis. Values are means ± SE. *P < 0.05 by t-test.
Fig. 7.
Fig. 7.
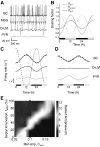
Damage to the medial septum can produce a circadian phase shift by altering the balance of circadian input. A: voltage traces showing examples of neural activity produced by the model. Cell types included in the model are basket cells (BC), medial septal GABAergic interneurons (MSG), stratum oriens interneurons projecting into the lacunosum moleculare (O-LM), and pyramidal neurons (PYR). B: 3 circadian inputs were included: circadian modulation of pyramidal cell current injection, circadian modulation of medial septal GABAergic cell current injection, and nightly attenuation of GABAA synaptic transmission by melatonin (see materials and methods). Each input was simulated by adjusting its respective scaling factor, Spyr, Sseptal, and Smel, over the 24-h cycle as shown. C and D: simulations of neural activity before (C) and after (D) the complete removal of medial septum input show a 180° phase shift in basket cell 24-h rhythms. MSG cells are indicated by dashed line. E: basket cell firing acrophase is a function of the percentage of septal innervation, fMSG, and the melatonin circadian scaling coefficient, Cmel (see materials and methods). Crosses mark simulation configurations in C and D; regions where sinusoids cannot be reliably fitted for phase estimation are shaded white. For a phase shift to occur, medial septal input must be sufficiently damaged such that the white boundary region is crossed.
Fig. 8.
Fig. 8.
Structural changes in the medial septum and fimbria in epileptogenic animals. A: quantified in vivo average diffusivity (AD), fractional anisotropy (FA), and T2 relaxation values for the medial septum in preinjury, 3 days post-SE, and 60 days post-SE stages for N = 6 rats. Statistically significant changes in AD and T2 are indicative of neuron loss in the medial septum. *P < 0.05, relative to preinjury measurement; #P < 0.05, relative to 3 days measurement. B: fiber tracking of the fimbria in excised control and spontaneously seizing rat brains 60 days post-SE. A significant reduction in total fiber volume is observed in the seizing rats (N = 8 rats) compared with control rats (N = 3 rats). *P < 0.05, unpaired t-test relative to control measurement. Values are means ± SE.
Fig. 9.
Fig. 9.
Schematic of changes during epileptogenesis and their proposed influence on epileptic seizures. A: functional changes in neural firing activity during epileptogenesis. Pyramidal (PYR) and basket cell (BC) firing rates are shown, and key events are numbered. Dotted line indicates the preinjury average firing rate for pyramidal cells. Solid lines serve as a guide to the eye for changes in the ratio of excitation to inhibition; reduced vertical distance between these lines indicates an increase in the excitation-to-inhibition ratio. Key events (i–v) during epileptogenesis are described below. B: structural changes in the hippocampus and surrounding network during epileptogenesis. Key events are as follows: i. Prior to injury, PYR and BC activity are balanced throughout the day. ii. Injury from SE attenuates circadian input to the hippocampus from regions such as the medial septum, creating an imbalance in circadian drive. iii. This produces a phase shift in the firing of basket cell activity. Additional damage caused by SE, such as hippocampal cell loss (B, ii), alters the average daily firing activity and sets epileptogenic processes in motion. iv. Epileptogenic processes, including further cell loss, sprouting, and other homeostatic mechanisms, drive the emergence of spontaneous seizures. v. These processes act in part to restore the daily average levels of excitatory and inhibitory activity (dotted line). However, they do not restore the correct balance of circadian input, and thus the phase shift persists. The circadian phase shift produces a time window during which the ratio of excitation to inhibition is increased relative to the preinjury period, as illustrated by the reduced distance between the solid lines in A. This provides an optimal time window for augmented seizure occurrence.
Fig. A1.
Fig. A1.
SPK acrophase estimate is not affected by choice of averaging window. A: SPK rate analysis (as in Fig. 4, A and B) is shown for a 6-h, 90%-overlapping smoothing window. Data are shown for Pre, Post-L, and Post-SS stages of epileptogenesis. Days are marked from the start of preinjury recording in i and from the day of SE in ii. Estimation of acrophase (as in Fig. 4C) is shown in iii. B: SPK rate analysis obtained with a 2-h, 15 min sliding window. Acrophase values estimated from cosine fits are 23.45, 14.47, and 16.22 h for the 6-h averaging (A, iii) and 23.80, 14.37, and 16.18 h for the 2-h averaging (B, iii), respectively.
Fig. A2.
Fig. A2.
Analysis of persistence of 24-h rhythm phase shift. A: SPK rates during the final days of recording. All data are taken from the postinjury spontaneously seizing stage (Post-SS) of epileptogenesis, from the same rat as shown in Fig. 4, A–C. Days are marked from the day of SE. Data from the solid vertical line onward mark the final 10 days of recording (Final-10), which was used for phase analysis. B: phase analysis performed on the marked region of data. All 3 rats showed SPK rates peaking in the afternoon, as was observed in the analysis of the entire Post-SS and latency (Post-L) stages in Fig. 4. C: the time of minimum SPK activity during the final 10 days of recording was significantly different from the preinjury (Pre) stage and was not substantially different from the Post-L and Post-SS period measurements made in Fig. 4D. Values are means ± SE. *P < 0.05 by t-test.
Fig. A3.
Fig. A3.
Simulation of network response to individual application of 3 different circadian inputs. A: circadian stimulation of PYR cells drives PYR, BC, and O-LM cell firing to peak during the day (circadian scaling factor Spyr, see materials and methods). B: septal input drives MSG cells to peak at midnight. This primarily affects BC and O-LM interneurons, causing them to peak at noon (Sseptal). C: melatonin-induced scaling of GABAergic synapses primarily affects BC, causing their firing rate to peak at midnight (Smel).

References

    1. Assaf SY, Miller JJ. The role of a raphe serotonin system in the control of septal unit activity and hippocampal desynchronization. Neuroscience 3: 539–550, 1978 - PubMed
    1. Barnes CA, McNaughton BL, Goddard GV, Douglas RM, Adamec R. Circadian rhythm of synaptic excitability in rat and monkey central nervous system. Science 197: 91–92, 1977 - PubMed
    1. Basser PJ. Inferring microstructural features and the physiological state of tissues from diffusion-weighted images. NMR Biomed 8: 333–344, 1995 - PubMed
    1. Bastlund JF, Jennum P, Mohapel P, Penschuck S, Watson WP. Spontaneous epileptic rats show changes in sleep architecture and hypothalamic pathology. Epilepsia 46: 934–938, 2005 - PubMed
    1. Bazil CW, Short D, Crispin D, Zheng W. Patients with intractable epilepsy have low melatonin, which increases following seizures. Neurology 55: 1746–1748, 2000 - PMC - PubMed

Publication types

LinkOut - more resources