. 2013 Aug 1;305(3):F323-32.
doi: 10.1152/ajprenal.00522.2012. Epub 2013 May 15.

ADAM17 mediates Nox4 expression and NADPH oxidase activity in the kidney cortex of OVE26 mice

Affiliations

ADAM17 mediates Nox4 expression and NADPH oxidase activity in the kidney cortex of OVE26 mice

Bridget M Ford et al. Am J Physiol Renal Physiol. .

Abstract

Matrix protein accumulation is a prominent feature of diabetic nephropathy that contributes to renal fibrosis and decline in renal function. The pathogenic mechanisms of matrix accumulation are incompletely characterized. We investigated if the matrix metalloprotease a disintegrin and metalloprotease1 7 (ADAM17), known to cleave growth factors and cytokines, is activated in the kidney cortex of OVE26 type 1 diabetic mice and the potential mechanisms by which ADAM17 mediates extracellular matrix accumulation. Protein expression and activity of ADAM17 were increased in OVE26 kidney cortex. Using a pharmacological inhibitor to ADAM17, TMI-005, we determined that ADAM17 activation results in increased type IV collagen, Nox4, and NADPH oxidase activity in the kidney cortex of diabetic mice. In cultured mouse proximal tubular epithelial cells (MCTs), high glucose increases ADAM17 activity, Nox4 and fibronectin expression, cellular collagen content, and NADPH oxidase activity. These effects of glucose were inhibited when cells were pretreated with TMI-005 and/or transfected with small interfering ADAM17. Collectively, these data indicate a novel mechanism whereby hyperglycemia in diabetes increases extracellular matrix protein expression in the kidney cortex through activation of ADAM17 and enhanced oxidative stress through Nox enzyme activation. Additionally, our study is the first to provide evidence that Nox4 is downstream of ADAM17.

Keywords: ADAM17; Nox4; OVE26 mice; diabetic nephropathy; extracellular matrix.


Figures
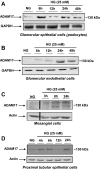
Fig. 1.
Fig. 1.
A disintegrin and metalloprotease1 7 (ADAM17) expression is upregulated in response to high glucose (HG) exposure in renal cells. A: glomerular epithelial cells were exposed to 25 mM d-glucose for varying time points before lysis and collection of cells for Western blot analysis. Normal glucose (NG) was used as a control (5 mM); 50 μg protein were resolved on a 7.5% SDS-PAGE and immunoblots were probed for anti-ADAM17. B: glomerular endothelial cells were exposed to 25 mM d-glucose for varying time points before lysis and collection of cells for Western blot analysis. NG was used as a control (5 mM); 50 μg protein were resolved on a 7.5% SDS-PAGE and immunoblots were probed for anti-ADAM17. C: glomerular mesangial cells were exposed to 25 mM d-glucose for varying time points before lysis and collection of cells for Western blot analysis. NG was used as a control (5 mM); 50 μg protein were resolved on a 7.5% SDS-PAGE and immunoblots were probed for anti-ADAM17. Images were cropped from the same membrane to show only normal glucose and HG treatments as another irrelevant agonist was used simultaneously in this experiment. D: proximal tubular epithelial cells were exposed to 25 mM d-glucose for varying time points before lysis and collection of cells for Western blot analysis. NG was used as a control (5 mM); 50 μg protein were resolved on a 7.5% SDS-PAGE and immunoblots were probed for anti-ADAM17.
Fig. 2.
Fig. 2.
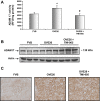
ADAM17 protein expression and enzymatic activity are increased in OVE26 kidney cortex. Five-month-old diabetic OVE26 mice were administered TMI-005, a pharmacological inhibitor to ADAM 17 (Pfizer-Wyeth), or vehicle control (2% TWEEN 80 and 0.5% methylcellulose) by oral gavage for an interval of 4 wk. FVB nondiabetic mice were only given vehicle control during the same duration. A: dounce homogenized whole kidney cortex was used to determine ADAM 17 activity levels by measuring cleavage of the internally quenched fluorogenic substrate MCA-KPLGL-Dpa-AR-NH2. Shown are means of 4 animals/group ± SE. *P < 0.05 vs. the FVB control group; #P < 0.05 vs. the OVE26 diabetic group. B: kidney cortex lysates were subjected to Western blot analysis and immunoblotted with anti-ADAM 17 antibody and anti-actin for loading control. Western blot is representative of 4 animals from each group. C: 5-μm thick frozen kidney cortex sections were stained with anti-ADAM 17 antibody using an immunoperoxidase method. Digital images are representative of 4 animals from each group.
Fig. 3.
Fig. 3.
Inhibition of ADAM17 with TMI-005 reduces collagen IV protein expression in OVE26 kidney cortex. Five-month-old diabetic OVE26 mice were administered TMI-005, a pharmacological inhibitor to ADAM 17 (Pfizer-Wyeth) or vehicle control (2% TWEEN 80 and 0.5% methylcellulose) by oral gavage for an interval of 4 wk. FVB nondiabetic mice were only given vehicle control during the same duration. A: frozen kidney cortex sections were stained with anti-type IV collagen α2 by immunoperoxidase method. Digital images are representative of 4 animals from each group. B: glomerular collagen IV α2-protein expression was calculated using Image-Pro Plus software. Shown are means ± SE of 20 imaged glomeruli per treatment group. ***P < 0.001, compared with FVB control group; ###P < 0.001, compared with OVE26 diabetic group. C: interstitial collagen IV α2-protein expression was calculated using Image-Pro Plus software. Shown are means ± SE of 20 imaged fields per treatment group. ***P < 0.001, compared with FVB control group; #P < 0.05, compared with OVE26 diabetic group. D: kidney cortex lysates were subjected to Western blot analysis and immunoblotted with anti-collagen IV α5-antibody and anti-actin for loading control. Western blots represent 4 animals from each group. E: pixel densitometry was performed using ImageJ software to quantitate differences in protein expression levels. Values are representative of the means of 4 animals from each group ± SE. *P < 0.05, compared with FVB control group.
Fig. 4.
Fig. 4.
ADAM17 activation mediates the effect of glucose on fibronectin protein expression and collagen content in mouse proximal tubular epithelial cells (MCTs). A: proximal tubular epithelial cells were serum-starved for 24 h and pretreated with 1 μM TMI-005 before exposure to 25 mM d-glucose for 4 h. Dounce homogenized samples were used to determine ADAM17 activity levels by measuring cleavage of the internally quenched fluorogenic substrate MCA-KPLGL-Dpa-AR-NH2. Shown are means of 6 experiments ± SE. *P < 0.05, compared with the control cells; #P < 0.05, compared with HG-treated cells. B: proximal tubular epithelial cells were serum-starved for 24 h and pretreated with 1 μM TMI-005 before exposure to 25 mM d-glucose for 4 h; 20 μg of cellular lysates were resolved on a 7.5% SDS-PAGE and immunoblotted for anti-fibronectin. C: pixel densitometry was performed using ImageJ software to quantitate differences in protein expression levels. Values are representative of the means of 4 experiments ± SE. *P < 0.05, compared with 4-h control, #P < 0.05, compared with 4 h HG. D: Proximal tubular epithelial cells were transfected with a pool of specific small interfering (si)RNAs for ADAM17 or non-targeting (NT) siRNA. mRNA expression analysis was performed using real-time qPCR to determine the efficiency of ADAM17 knockdown. Shown are the means of 5 experiments + S.E. Statistics were determined by Student's unpaired t-test. ##P < 0.01, compared with NT transfected cells. E: proximal tubular epithelial cells were transfected with a pool of specific siRNAs for ADAM17 or NT siRNA; 20 μg of cellular lysates were resolved on a 7.5% SDS-PAGE and immunoblotted for anti-ADAM17 to determine ADAM17 knockdown efficiency. F: proximal tubular epithelial cells were transfected with a pool of specific siRNAs for ADAM17 or NT siRNA and serum-starved for 24 h before exposure to 25 mM d-glucose for 4 h; 20 μg of cellular lysates were resolved on a 7.5% SDS-PAGE and immunoblotted for anti-fibronectin. G: pixel densitometry was performed using ImageJ software to quantitate differences in protein expression levels. Values are representative of the means of 5 experiments from each group ± SE. ***P < 0.001, compared with NT 4-h control; ##P < 0.01, compared with NT 4 h HG. H: proximal tubular epithelial cells were transfected with a pool of specific siRNAs for ADAM17 or NT siRNA and serum-starved for 24 h before exposure to 25 mM d-glucose for 4 h. Collagen content was determined using picrosirius-red staining with a Sircol colorimetric assay. Shown are the means of 3 experiments ± SE. *P < 0.05, compared with the NT transfected control cells; #P < 0.05, compared with NT transfected HG-treated cells.
Fig. 5.
Fig. 5.
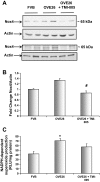
ADAM17 mediates Nox4 protein expression and NADPH oxidase activity in OVE26 kidney cortex. Five-month-old diabetic OVE26 mice were administered TMI-005, a pharmacological inhibitor to ADAM 17 (Pfizer-Wyeth) or vehicle control (2% TWEEN 80 and 0.5% methylcellulose) by oral gavage for an interval of 4 wk. FVB nondiabetic mice were only given vehicle control during the same duration. A: kidney cortex lysates were subjected to Western blot analysis and immunoblotted with anti-Nox4 antibody and anti-actin for loading control. Western blots represent 4 animals from each group. B: pixel densitometry was performed using ImageJ software to quantify protein expression levels. Values are representative of the means of 4 animals from each group ± SE. #P < 0.05, compared with OVE26 diabetic group. C: dounce homogenized kidney cortex samples were used to determine NADPH oxidase levels using a lucigenin-enhanced chemiluminescent assay. Shown are means of 4 animals/group ± SE. *P < 0.05 vs. the FVB control group by one-way ANOVA with post hoc Tukey analysis.
Fig. 6.
Fig. 6.
Glucose-induced ADAM17 activation mediates Nox4 protein expression and NADPH oxidase activity in MCTs. A: proximal tubular epithelial cells were serum starved for 24 h and pretreated with 1 μM TMI-005 before exposure to 25 mM d-glucose for 4 h; 40 μg of cellular lysates were resolved on a 7.5% SDS-PAGE and immunoblotted for anti-Nox4. B: pixel densitometry was performed using ImageJ software to quantitate differences in protein expression levels. Values are representative of the means of 3 experiments from each group ± SE. *P < 0.05, compared with 4-h control, #P < 0.05, compared with 4-h HG. C: proximal tubular epithelial cells were serum-starved for 24 h and pretreated with 1 μM TMI-005 before exposure to 25 mM d-glucose for 4 h. Dounce homogenized samples were used to determine NADPH oxidase levels using a lucigenin-enhanced chemiluminescence assay. Shown are means of 4 experiments ± SE. **P < 0.01 vs. control cells; ##P < 0.01 vs. HG-treated cells. D: proximal tubular epithelial cells were transfected with a pool of specific siRNAs for ADAM17 or NT siRNA and serum-starved for 24 h before exposure to 25 mM d-glucose for 4 h; 20 μg of cellular lysates were resolved on a 7.5% SDS-PAGE and immunoblotted for anti-Nox4. E: pixel densitometry was performed using ImageJ software to quantitate differences in protein expression levels. Values are representative of the means of 5 experiments from each group ± SE. *P < 0.05, compared with NT 4-h control, #P < 0.05 compared with NT 4 h HG. F: proximal tubular epithelial cells were transfected with a pool of specific siRNAs for ADAM17 or NT siRNA and serum-starved for 24 h before exposure to 25 mM d-glucose for 4 h. Dounce homogenized samples were used to determine NADPH oxidase levels using a lucigenin-enhanced chemiluminescent assay. Shown are means of 5 experiments + SE. #P < 0.05 vs. NT control cells; *P < 0.05 vs. NT control cells; ##P < 0.01 vs. siADAM17 transfected 4-h HG-treated cells.
Fig. 7.
Fig. 7.
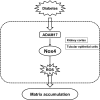
Proposed mechanism of HG/diabetes-induced extracellular matrix accumulation in proximal tubular epithelial cells. See discussion for details.

Similar articles

Cited by

References

    1. Akool e Gauer S, Osman B, Doller A, Schulz S, Geiger H, Pfeilschifter J, Eberhardt W. Cyclosporin A and tacrolimus induce renal Erk1/2 pathway via ROS-induced and metalloproteinase-dependent EGF-receptor signaling. Biochem Pharmacol 83: 286–295, 2012 - PubMed
    1. Barnes JL, Gorin Y. Myofibroblast differentiation during fibrosis: role of NAD(P)H oxidases. Kidney Int 79: 944–956, 2011 - PMC - PubMed
    1. Bell HL, Gooz M. ADAM-17 is activated by the mitogenic protein kinase ERK in a model of kidney fibrosis. Am J Med Sci 339: 105–107, 2010 - PMC - PubMed
    1. Black RA, Rauch CT, Kozlosky CJ, Peschon JJ, Slack JL, Wolfson MF, Castner BJ, Stocking KL, Reddy P, Srinivasan S, Nelson N, Boiani N, Schooley KA, Gerhart M, Davis R, Fitzner JN, Johnson RS, Paxton RJ, March CJ, Cerretti DP. A metalloproteinase disintegrin that releases tumour-necrosis factor-alpha from cells. Nature 385: 729–733, 1997 - PubMed
    1. Blobel CP. ADAMs: key components in EGFR signalling and development. Nat Rev Mol Cell Biol 6: 32–43, 2005 - PubMed

Publication types

MeSH terms

LinkOut - more resources