. 2013 May 15;33(20):8909-21.
doi: 10.1523/JNEUROSCI.4369-12.2013.

The synchronous activity of lateral habenular neurons is essential for regulating hippocampal theta oscillation

Affiliations

The synchronous activity of lateral habenular neurons is essential for regulating hippocampal theta oscillation

Hidenori Aizawa et al. J Neurosci. .

Abstract

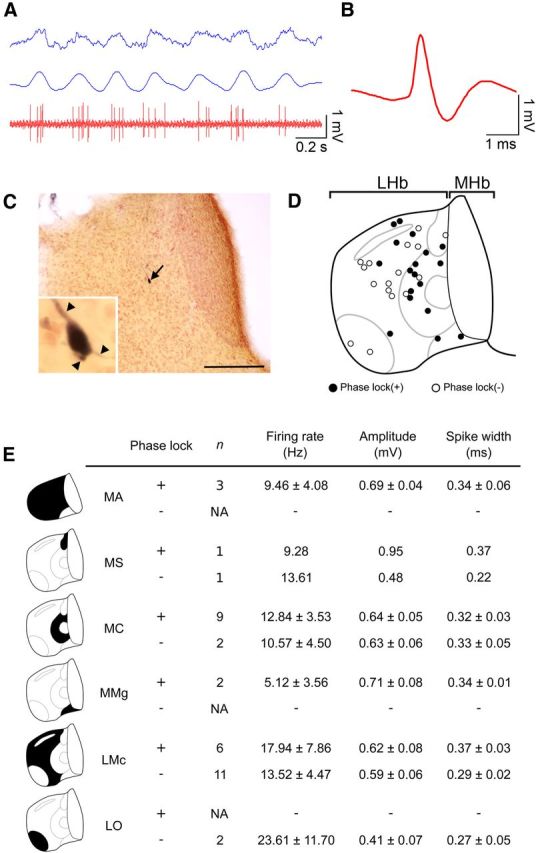
Lateral habenula (LHb) has attracted growing interest as a regulator of serotonergic and dopaminergic neurons in the CNS. However, it remains unclear how the LHb modulates brain states in animals. To identify the neural substrates that are under the influence of LHb regulation, we examined the effects of rat LHb lesions on the hippocampal oscillatory activity associated with the transition of brain states. Our results showed that the LHb lesion shortened the theta activity duration both in anesthetized and sleeping rats. Furthermore, this inhibitory effect of LHb lesion on theta maintenance depended upon an intact serotonergic median raphe, suggesting that LHb activity plays an essential role in maintaining hippocampal theta oscillation via the serotonergic raphe. Multiunit recording of sleeping rats further revealed that firing of LHb neurons showed significant phase-locking activity at each theta oscillation cycle in the hippocampus. LHb neurons showing activity that was coordinated with that of the hippocampal theta were localized in the medial LHb division, which receives afferents from the diagonal band of Broca (DBB), a pacemaker region for the hippocampal theta oscillation. Thus, our findings indicate that the DBB may pace not only the hippocampus, but also the LHb, during rapid eye movement sleep. Since serotonin is known to negatively regulate theta oscillation in the hippocampus, phase-locking activity of the LHb neurons may act, under the influence of the DBB, to maintain the hippocampal theta oscillation by modulating the activity of serotonergic neurons.


Conflict of interest statement

The authors declare no conflict of interests.

Figures

Figure 1.
Figure 1.
Intact lateral habenular function is essential for maintaining the hippocampal theta oscillation. A, B, Coronal sections of the habenula in rats that previously received either a sham (A) or lesion operation (B) showing the extent of destruction and gliosis (B, arrowheads). Asterisks indicate the medial habenula. Insets are magnified views of the gray-boxed areas in the left habenula. C, D, Power spectral density of LFP recorded from the pyramidal cell layer in the hippocampal CA1 of the sham-operated (blue line) and lesion-operated rats (red line) under urethane anesthesia (C, N = 6 for sham operation group, and N = 11 for lesioned group) and during REM sleep (D, N = 6 for sham operation group, and N = 7 for lesioned group). Solid and dotted lines indicate the mean and mean ± SEM for the sham- and lesion-operated rats, respectively. Insets of each panel show enlarged views of the power spectrum for the theta wave under urethane anesthesia (3–6 Hz) and during REM sleep (5–8 Hz). E, F, Bar graphs showing the proportion of time with and without the hippocampal theta under urethane anesthesia (theta and non-theta periods, respectively, in E) and with REM and NREM sleep (F) in the animals subjected to the sham operation (blue, N = 6), habenula-lesion (red, N = 11), and habenula-lesion plus DHT injection into the median raphe (light blue, N = 7). G, H, Bar graphs showing the mean duration of a single theta bout (G) and theta amplitude (H) of the theta oscillation in the hippocampus of the sham-operated (blue) and lesion-operated (red) rats under urethane anesthesia (bars on the left) and during REM sleep (bars on the right). *p < 0.05, **p < 0.01, comparison with statistical significance (Scheffé's multiple-comparison test following one-way ANOVA for the three-group data and one-tailed t test for the two-group data). Values are presented as the mean ± SEM. Scale bar, 1 mm.
Figure 2.
Figure 2.
Changes in the firing pattern of the lateral habenular and hippocampal neurons according to the transition from NREM to REM sleep. A, Raw data (upper four traces) and the extracted spike trains (raster below the raw traces) simultaneously recorded in the lateral habenula (red) and the pyramidal cell layer of the hippocampal CA1 region (blue) during non-REM and REM sleep. Top panel is rostral. B, Representative recording of the brain and muscle activities in the awake (top), non-REM (middle), and REM sleep states (bottom). Panels represent the front view of the animals used for the video monitoring of behaviors (left), cortical electroencephalogram (Cx, top trace on the right), local field potential in the hippocampus (HPC, middle trace on the right), and EMG recorded from the neck muscle (bottom trace on the right). C, Autocorrelogram (top panels for each color) and interspike interval histogram (bottom panels) of the representative neurons in the lateral habenula (red) and hippocampus (blue) showing the changes in firing pattern according to the transition from NREM (left column) to REM sleep (right column). D, Raw (upper blue trace) and filtered (lower blue trace) theta traces and the spike train of a lateral habenular neuron (upper red raster) and a hippocampal neuron (lower blue raster) showing the preferential firing near peak and trough of each theta cycle, respectively, during the period indicated by the boxed area in A.
Figure 3.
Figure 3.
Phase-locking activities of the lateral habenular and hippocampal neurons. A–C, Examples of unit activity of neurons in the lateral habenula (red, A) and a pyramidal cell (light blue, B) and an interneuron in the hippocampus (dark blue, C) showing in the raster plots (top panels) and in the phase histogram of the firing probability within the time window made by subdividing each theta cycle (360°) into 20 bins (bottom panels). Data were replicated over two theta cycles for visual clarity. D–F, Distribution of log-transformed Rayleigh's Z value, a statistical value used to evaluate the significance of phase locking for the lateral habenular neurons (D), the pyramidal cells (E), and interneurons (F) in the hippocampus. Dashed black lines indicate the p = 0.01 significance thresholds, which were used to identify the phase-locking neurons. G–I, Changes in the mean firing rate of the recorded neurons showing phase locking (solid lines) and those without phase-locking activity (dotted lines) in the lateral habenula (G) and hippocampus (pyramidal cells in H and interneurons in I) across the brain states. Error bars indicate SEMs. J–L, Scatter plots showing the preferred phase of the phase-locking neurons against the spike width in the lateral habenula (J) and hippocampus (pyramidal cells in K and interneurons in L). M–O, Histograms showing the frequency of the theta phase preferred by the phase-locking neurons recorded in the lateral habenula (M) and hippocampus (pyramidal cells in N and interneurons in O). Arrows and arrowheads in M indicate the neuronal groups in the lateral habenula preferring the ascending and descending phases of the theta cycle, respectively.
Figure 4.
Figure 4.
Coordination of phase-locking activity in the lateral habenula with fluctuating cycles in the hippocampal theta oscillation. A, B, Rayleigh's Z value computed as a function of temporal offset (from −1000 to 1000 ms with 5 ms bins) between the hippocampal theta trace and the spike train of lateral habenular (A) and hippocampal (B) neurons (positive temporal offset indicates shifting the theta trace forward). The inserts explicitly show the theta-triggered rasters and firing probability along the binned phase value at temporal offsets = −200, 25, and 400 ms for A, and −250, −45, and 500 ms for B. Vertical black dashed lines and horizontal red dashed lines indicate zero in temporal offset and the threshold of Z value for the statistical significance (p = 0.01/201 by Bonferroni's correction), respectively. C, D, Pseudocolor plots of the populational Z-shift analysis summarizing the Rayleigh's Z value normalized with the maximal Z value as a function of temporal offset for each neuron. Z values for the dataset shifted by 5 ms for each neuron were displayed in rows and were sorted by maximal Z value in descending order (n = 95 for the lateral habenula and n = 199 for the hippocampus). Red, light blue, and dark blue dots indicate the recordings from the lateral habenular neurons, putative hippocampal pyramidal cells, and putative hippocampal interneurons, respectively. Dots (lateral habenular and putative hippocampal pyramidal neurons) and triangles (putative hippocampal interneurons) indicate the location of the temporal offset at which the distribution showed the maximal Z value, and the color signifies whether (red, lateral habenular neurons; light blue, putative pyramidal cells; dark blue, putative interneurons) or not (white) the maximal Z value exceeded the significance threshold. E, Box plots showing the log-transformed value of the maximal Z value for the lateral habenular neurons (red), pyramidal cells (light blue), and interneurons (dark blue) in the hippocampus. F, Bar graphs showing the mean values of the temporal offset with maximal Z value for the lateral habenular neurons (red), hippocampal pyramidal cells (light blue), and interneurons (dark blue). Error bars indicate SEM.
Figure 5.
Figure 5.
Diagonal band of Broca as a common input to the lateral habenula and hippocampus. A, B, D, E, G, H, Coronal sections of the lateral habenula (A), hippocampus (B), and diagonal band (D, E, G, H) showing the localization of retrograde tracers injected into the lateral habenula (cholera toxin B conjugated with Alexa Fluor 488, black in A) and hippocampus CA1 region (Fluoro-Gold, black in B), and the distribution of retrogradely labeled neurons (D, E, G, H). G and H are magnified views of the boxed areas in D and E, respectively. C, A coronal section of the vertical limb of the diagonal band of Broca showing the retrogradely labeled neurons projecting to the lateral habenula (cholera toxin B conjugated with Alexa Fluor 488, green) and to the hippocampus (Fluoro-Gold, red). Note that both the red and green signals were distributed in the vDBB. Sections were counterstained with DAPI (blue). F, I, Representative images of the vDBB neurons projecting to the lateral habenula showing colocalization of the tracer (green) with Gad67 mRNA (red in F) and ChAT (red in I). Scale bars: A, B, D, E, 1 mm; C, G, H, 300 μm; F, I, 25 μm.
Figure 6.
Figure 6.
Specific localization of the phase-locking neurons in the medial division of the lateral habenula revealed by juxtacellular labeling. A, A representative activity of the lateral habenular neurons (red at the bottom) showing the preferential firing around the positive peak of the hippocampal theta oscillation (blue at the top, raw trace; blue at the middle, filtered trace between 3 and 6 Hz). B, Average spike shape of the neurons shown in A. C, A coronal section of the habenula showing the localization of a labeled neuron presented in A (black arrow). Inset shows the magnified view of cell body of a labeled neuron with three dendrites (arrowheads). D, Schematic diagram of the coronal section of the rat habenula showing the distribution of the recorded neurons identified by juxtacellular labeling. Black and white filled circles indicate the neurons with and without phase-locking activity, respectively. E, Summary table of the phase-locking activity, number of recorded neurons, firing rate, amplitude, and half-width of the spikes of the recorded neurons in the six subnuclei of the lateral habenula. Values are presented as mean ± SEM. LHbMA, anterior part of LHbM; LHbMMg, marginal part of LHbM; LHbMS, superior part of LHbM; LHbLO, oval part of LHbL; NA, not available. Scale bar, 200 μm.

References

    1. Adhikari A, Topiwala MA, Gordon JA. Synchronized activity between the ventral hippocampus and the medial prefrontal cortex during anxiety. Neuron. 2010;65:257–269. doi: 10.1016/j.neuron.2009.12.002. - DOI - PMC - PubMed
    1. Aizawa H, Amo R, Okamoto H. Phylogeny and ontogeny of the habenular structure. Front Neurosci. 2011;5:138. doi: 10.3389/fnins.2011.00138. - DOI - PMC - PubMed
    1. Aizawa H, Kobayashi M, Tanaka S, Fukai T, Okamoto H. Molecular characterization of the subnuclei in rat habenula. J Comp Neurol. 2012;520:4051–4066. doi: 10.1002/cne.23167. - DOI - PubMed
    1. Ambrosini MV, Mariucci G, Colarieti L, Bruschelli G, Carobi C, Giuditta A. The structure of sleep is related to the learning ability of rats. Eur J Neurosci. 1993;5:269–275. doi: 10.1111/j.1460-9568.1993.tb00493.x. - DOI - PubMed
    1. Amo R, Aizawa H, Takahoko M, Kobayashi M, Takahashi R, Aoki T, Okamoto H. Identification of the zebrafish ventral habenula as a homolog of the mammalian lateral habenula. J Neurosci. 2010;30:1566–1574. doi: 10.1523/JNEUROSCI.3690-09.2010. - DOI - PMC - PubMed

Publication types

MeSH terms

LinkOut - more resources