. 2013 Jul;87(14):8135-44.
doi: 10.1128/JVI.03159-12. Epub 2013 May 15.

Epstein-Barr virus-encoded microRNA BART15-3p promotes cell apoptosis partially by targeting BRUCE

Affiliations

Epstein-Barr virus-encoded microRNA BART15-3p promotes cell apoptosis partially by targeting BRUCE

Hoyun Choi et al. J Virol. 2013 Jul.

Abstract

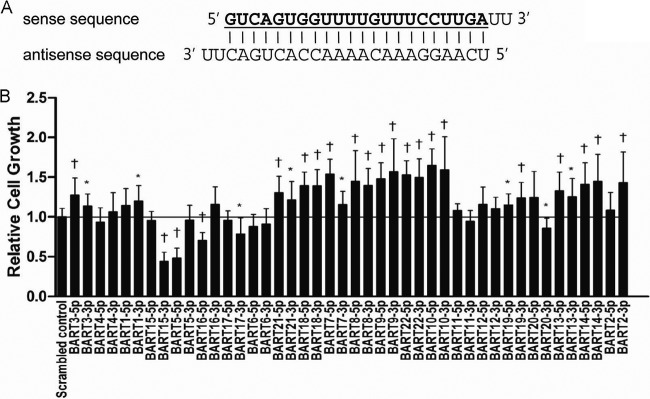
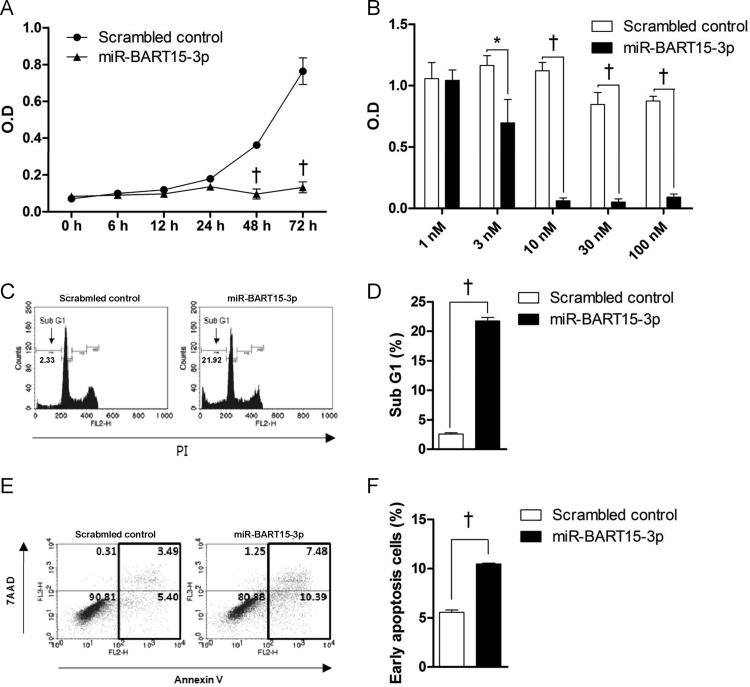
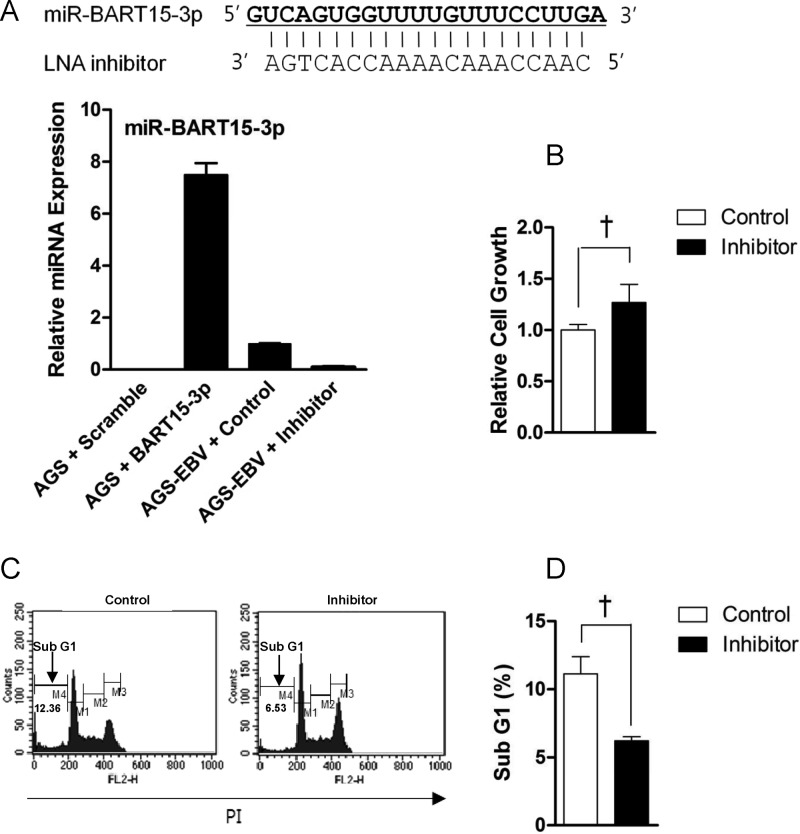
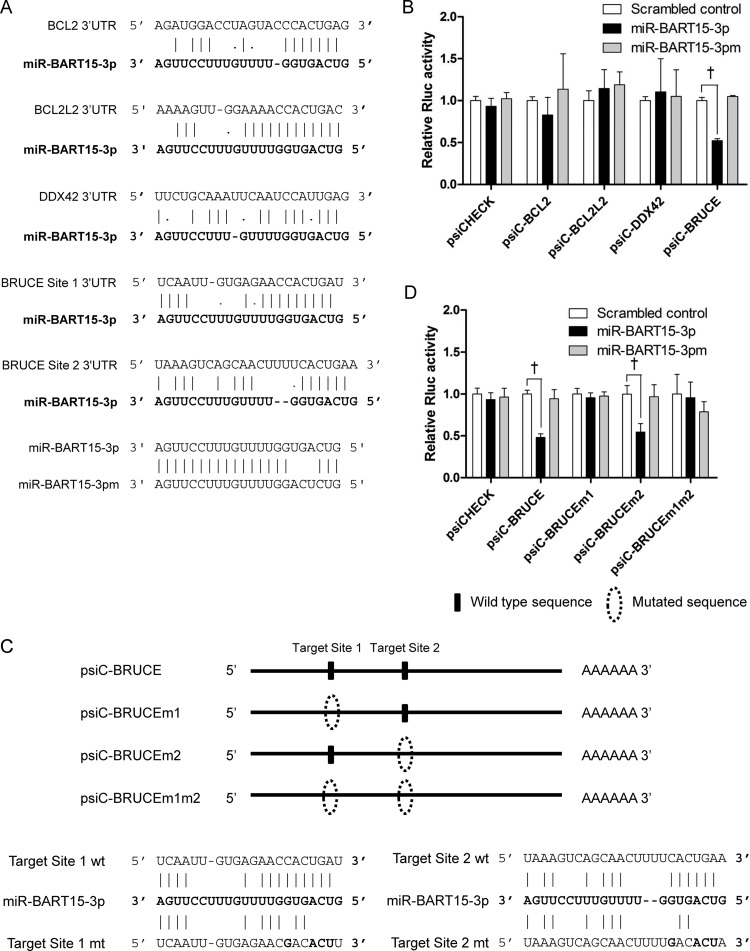
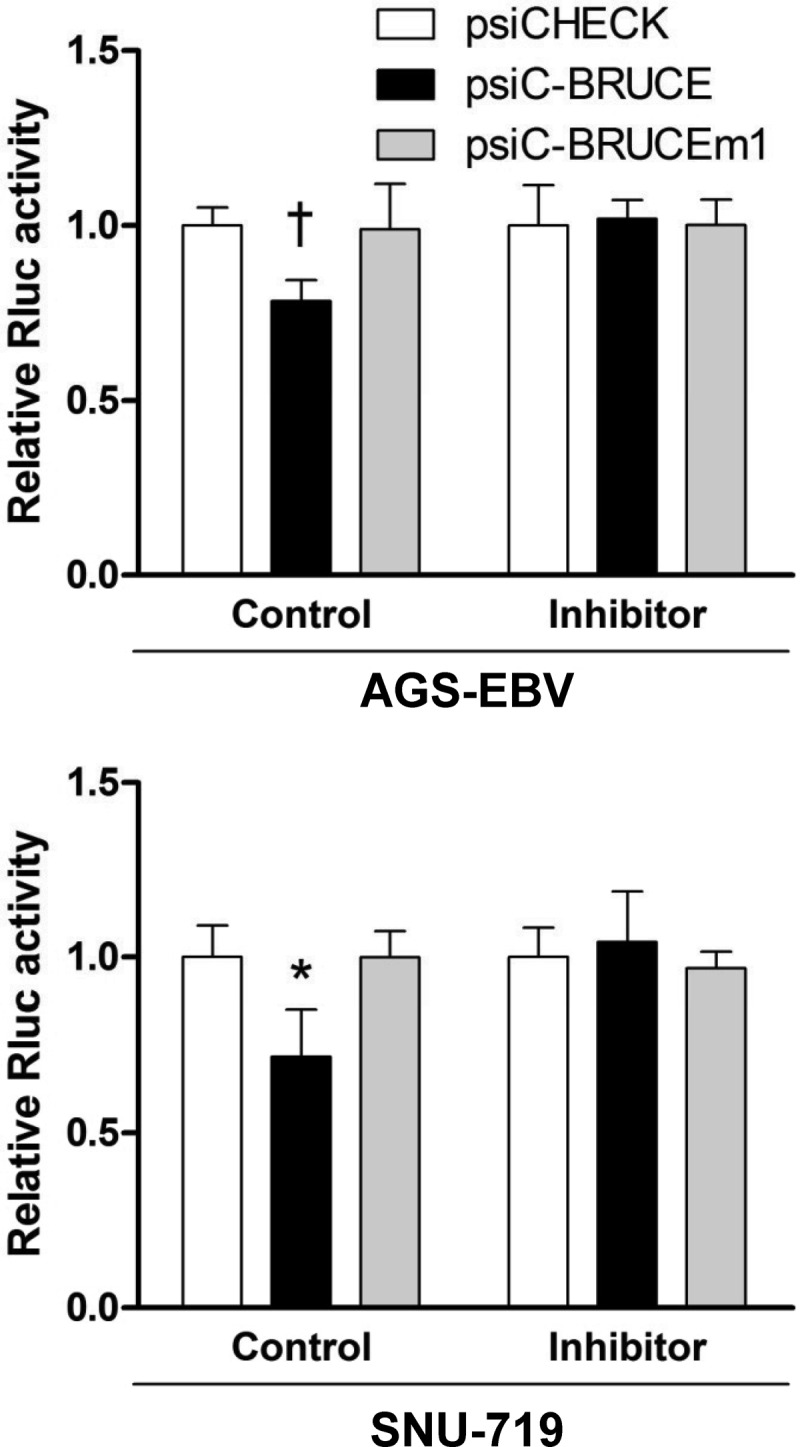
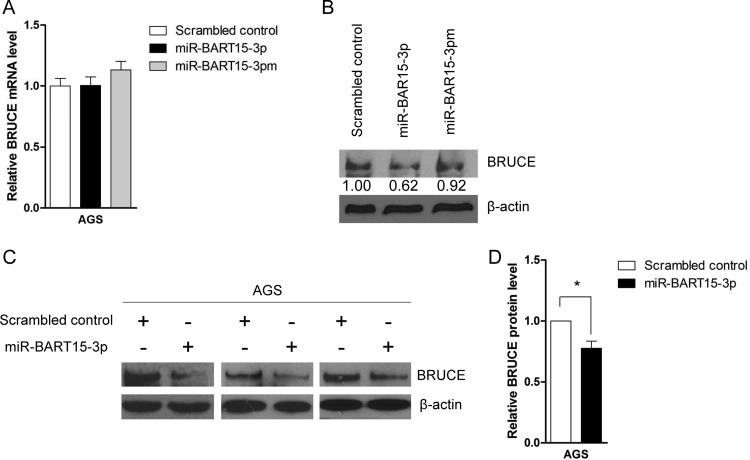
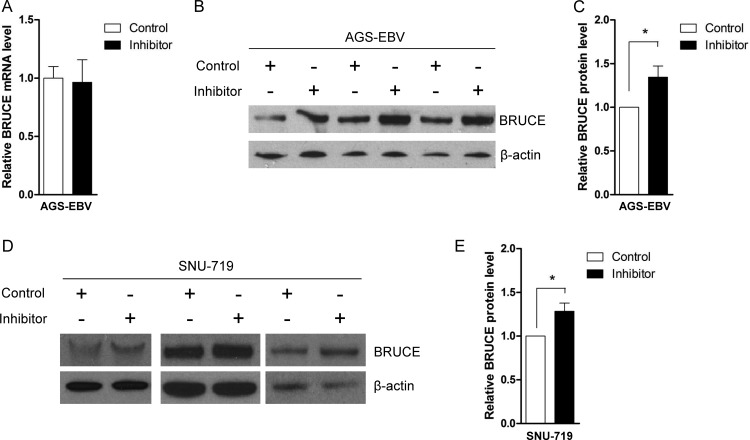
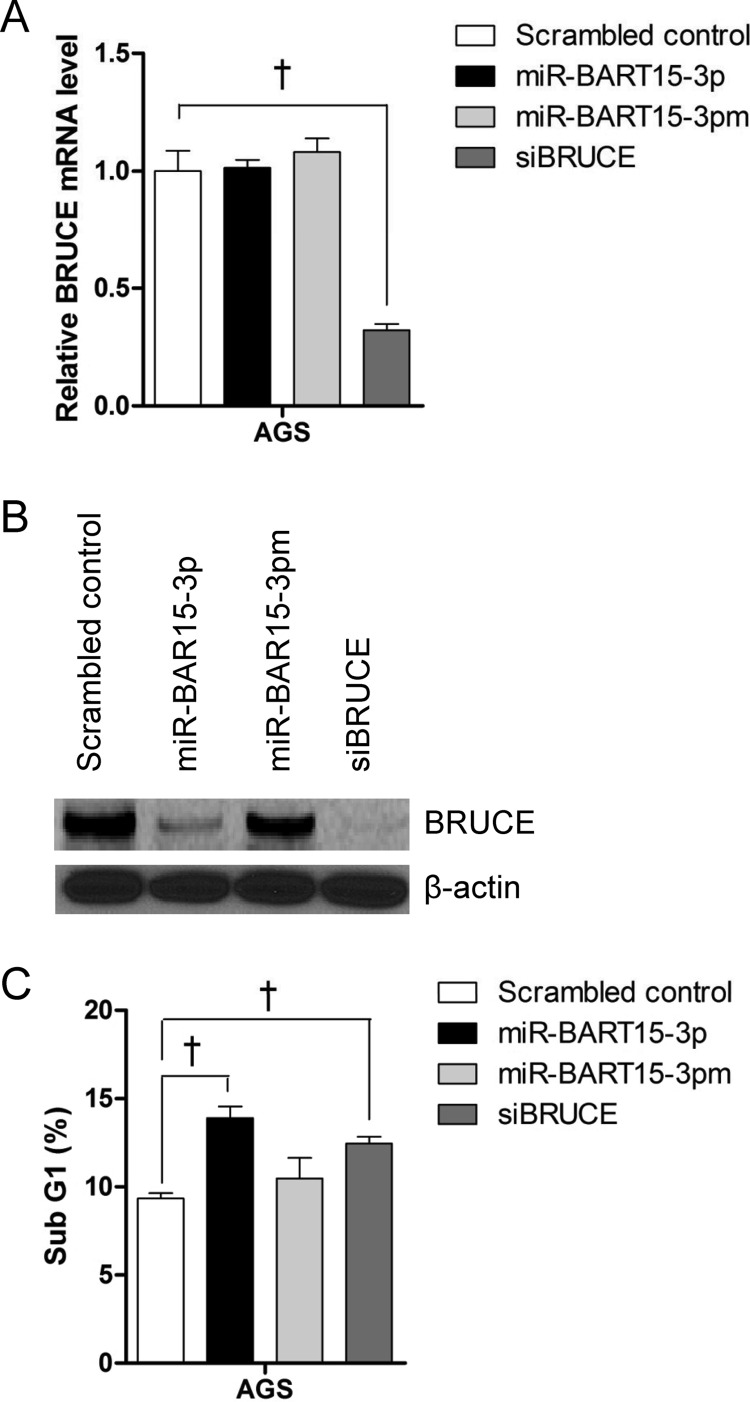
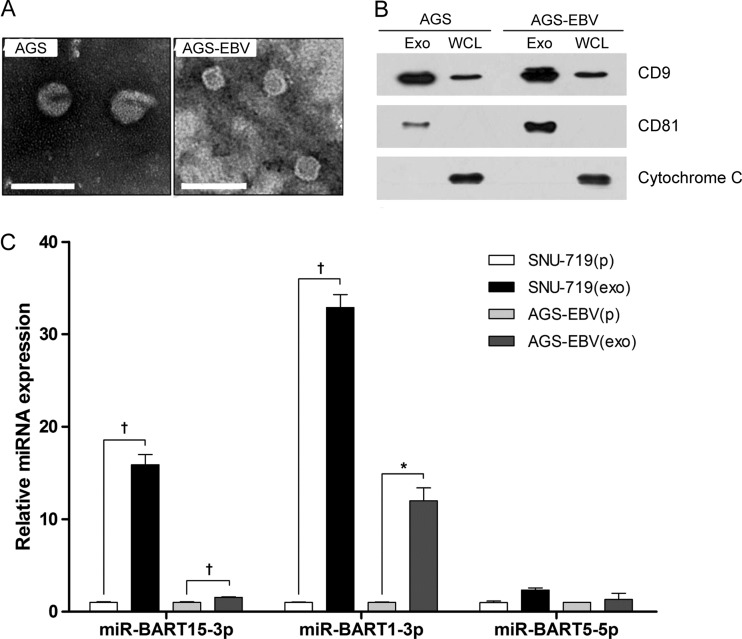
Epstein-Barr Virus (EBV) generates a variety of viral microRNAs (miRNAs) by processing the BHRF1 and BamHI A rightward (BART) transcripts. BART miRNAs are expressed in all cells latently infected with EBV, but the functions of most BART miRNAs remain unknown. The results of a cell proliferation assay revealed that miR-BART15-3p inhibited cell proliferation. Fluorescence-activated cell sorting following staining with annexin V or propidium iodide showed that miR-BART15-3p promoted apoptosis. Furthermore, the inhibitor for miR-BART15-3p increased cell growth and reduced apoptosis in EBV-infected cells. Using bioinformatic analyses, we predicted that miR-BART15-3p may target the antiapoptotic B-cell lymphoma 2 (BCL2), BCL2L2, DEAD (Asp-Glu-Ala-Asp) box polypeptide 42 (DDX42), and baculovirus inhibitor of apoptosis repeat-containing ubiquitin-conjugating enzyme (BRUCE) mRNAs. The luciferase reporter assay showed that only the 3' untranslated region (UTR) of BRUCE was affected by miR-BART15-3p. Two putative seed-matched sites for miR-BART15-3p were evident on the BRUCE 3' UTR. The results of a mutation study indicated that miR-BART15-3p hybridized only with the first seed-matched site on the BRUCE 3' UTR. miR-BART15-3p downregulated the BRUCE protein in EBV-negative cells, while the inhibitor for miR-BART15-3p upregulated the BRUCE protein in EBV-infected cells without affecting the BRUCE mRNA level. miR-BART15-3p was secreted from EBV-infected gastric carcinoma cells, and the level of miR-BART15-3p was 2- to 16-fold higher in exosomes than in the corresponding cells. Our data suggest that miR-BART15-3p can induce apoptosis partially by inhibiting the translation of the apoptosis inhibitor BRUCE. Further study is warranted to understand the role of miR-BART15-3p in the EBV life cycle.


Figures

Fig 1
Fig 1
Effects of each individual BART miRNA on cell growth in AGS. Cells were transfected with each individual BART miRNA or the scrambled control. (A) The miR-BART15-3p mimic, which has a 2-uracil (U) overhang at the 3′ end of both strands, is shown. All the other BART miRNA mimics were designed in a similar pattern. (B) The degree of cell proliferation was analyzed using the CCK-8 assay kit after 72 h (n = 9). Error bars indicate SD. *, P < 0.05; †, P < 0.01.
Fig 2
Fig 2
Effect of miR-BART15-3p on cell proliferation and apoptosis. (A) Cells were seeded in a 96-well plate and then transfected with the miR-BART15-3p mimic or the scrambled control. After the indicated periods, 10 μl of CCK-8 solution was added to each well to check cell proliferation. (B) Cells were transfected with the indicated concentrations of the miR-BART15-3p mimic or the scrambled control. After 72 h, 10 μl of CCK-8 solution was added to each well. (C) Cells were transfected with the miR-BART15-3p mimic or the scrambled control and analyzed after 72 h. The proportion of the sub-G1 population was evaluated following propidium iodide staining. (D) Results similar to those in panel C were obtained in two more independent experiments, and the means and SD from all three independent experiments are plotted. (E) Cells were transfected with the miR-BART15-3p mimic or the scrambled control and analyzed after 72 h. The proportions of apoptotic cells were accessed by PE-Annexin V staining. (F) Results similar to those in panel E were obtained in two more independent experiments, and the means and SD from all three independent experiments are plotted. Error bars indicate SD (n = 3). *, P < 0.05; †, P < 0.01.
Fig 3
Fig 3
Effect of the inhibitor for miR-BART15-3p on AGS-EBV cells. (A) The sequence of the LNA inhibitor for miR-BART15-3p is shown at the top. The endogenous expression of miR-BART15-3p in AGS-EBV cells was analyzed by the TaqMan miRNA assay 72 h after transfection with the LNA-miR-BART15-3p inhibitor or the LNA control. (B) To determine the effect of the miR-BART15-3p inhibitor on cell proliferation, AGS-EBV cells in a 96-well plate were transfected with the inhibitor or the control LNA. After 72 h, 10 μl of CCK-8 solution was added to each well. (C) AGS-EBV cells were transfected with the inhibitor or the control LNA. The proportion of the sub-G1 population was evaluated 72 h later by PI staining. (D) Results similar to those in panel C were obtained in two more independent experiments, and the means and SD from all three independent experiments are plotted. †, P < 0.01.
Fig 4
Fig 4
Target search for miR-BART15-3p. (A) Seed-matched regions of the putative target genes for miR-BART15-3p are shown. (B) To test whether the putative target genes are regulated by miR-BART15-3p, the 3′ UTR fragment of each gene was cloned into a luciferase reporter (psiCHECK-2) vector. HEK293T cells were cotransfected with the miR-BART15-3p mimic and the appropriate 3′ UTR reporter plasmid. To confirm the sequence-specific function of miR-BART15-3p, miR-BART15-3pm (the sequence is shown at the bottom of panel A), which has substituted nucleotides at ∼4 to 6 sites of miR-BART15-3p, was also used. Luciferase activity was analyzed 48 h after transfection (n = 3). (C) Illustration showing the location of the possible seed-matched sites for miR-BART15-3p on the BRUCE 3′ UTR and the sites changed to produce mutated forms of psiC-BRUCE. (D) HEK293T cells were cotransfected with miR-BART15-3p and the indicated psiC-BRUCE vector containing the wild-type or mutated 3′ UTR of BRUCE. Luciferase activity was normalized using firefly luciferase activity. Error bars indicate SD (n = 3). †, P < 0.01.
Fig 5
Fig 5
Effect of Inhibitor for miR-BART15-3p on the luciferase activity of the psiC-BRUCE reporter vector cotransfected into EBV-infected cells. AGS-EBV cells were cotransfected with the inhibitor or the control LNA and the psiC-BRUCE vector containing the wild-type or mutated 3′ UTR of BRUCE (top). Experiments similar to those described above were also performed using a naturally EBV-infected gastric carcinoma cell line, SNU-719 (bottom). The observed luciferase activity was normalized to that of firefly luciferase. Error bars indicate SD (n = 3). *, P < 0.05; †, P < 0.01.
Fig 6
Fig 6
Effect of miR-BART15-3p on the mRNA and protein levels of BRUCE. AGS cells were transfected with the miR-BART15-3p mimic or the scrambled control. Cells were harvested after 48 h to extract RNA or protein. (A) Real-time RT-PCR for BRUCE mRNA was carried out using the SYBR green qPCR kit. Relative gene expression was calculated according to the comparative CT method using GAPDH as an internal control. (B) Anti-BRUCE (1:1,000) and anti-β-actin (1:1,000) antibodies were used for Western blot analysis. β-Actin antibody was used to confirm comparable loading. (C) The effect of miR-BART15-3p on BRUCE expression was analyzed by Western blots using three independently transfected AGS cell batches, and similar results were obtained from them. (D) The Western blot of BRUCE shown in panel C was quantified and normalized to β-actin, and results are presented as a bar graph. *, P < 0.05.
Fig 7
Fig 7
Effect of LNA-miR-BART15-3p inhibitor on BRUCE mRNA and protein levels. AGS-EBV cells were transfected with the LNA-miR-BART15-3p inhibitor or the control LNA. The cells were harvested after 48 h to extract RNA or protein. (A) Real-time RT-PCR for BRUCE mRNA was carried out using the SYBR green qPCR kit. Relative gene expression was calculated according to the comparative CT method using GAPDH as an internal control. (B and D) Anti-BRUCE (1:1,000) and anti-β-actin (1:1,000) antibodies were used for Western blot analysis. The β-actin antibody was used to confirm comparable loading. The effect of LNA-miR-BART15-3p inhibitor on the expression of BRUCE in the EBV-infected gastric cancer cells was analyzed by Western blots using three independently transfected AGS-EBV (B) and SNU-719 (D) cell batches. Similar results were obtained from both cell lines. (C and E) The results of the Western blot of BRUCE expression shown in panels B and D were quantified and normalized to β-actin, and the results are presented as bar graphs. *, P < 0.05.
Fig 8
Fig 8
Effect of siRNA for BRUCE (siBRUCE) on BRUCE expression and apoptosis. The expression levels of BRUCE mRNA (A) and protein (B) in AGS cells 48 h after transfection with the miR-BART15-3p mimic siBRUCE or the scrambled control were measured by qRT-PCR and Western blot, respectively. GAPDH and β-actin were used as internal controls for qRT-PCR and Western blot, respectively. (C) AGS cells were transfected with the miR-BART15-3p mimic siBRUCE or the scrambled control. The proportion of the sub-G1 cell population was measured after 72 h by PI staining and FACS analysis. Error bars indicate SD (n = 3). †, P < 0.01.
Fig 9
Fig 9
Detection of miR-BART15-3p in exosomes isolated from EBV-infected gastric carcinoma cells. AGS, AGS-EBV, and SNU-719 cells were cultured with RPMI containing 10% serum which had previously been depleted of FBS-derived exosomes. The cell culture medium was harvested after 48 h to isolate exosomes. (A) TEM analysis of exosomes from AGS and AGS-EBV cells. Scale bar, 100 nm. (B) Western blot analysis of proteins used as exosome markers (CD9 and CD81) and an intracellular marker (cytochrome C). One microgram of exosomes and 50 μg of whole-cell lysate (WCL) were used. (C) Quantitative real-time RT-PCR for miR-BART15-3p, miR-BART1-3p, and miR-BART5-5p was carried out using the TaqMan miRNA assay with 5 ng of total RNA each from exosomes and cell pellets. The level of exosomal miRNA expression relative to that of the cell pellet was calculated according to the comparative CT method. *, P < 0.05; †, P < 0.01.

References

    1. Bartel DP. 2004. MicroRNAs: genomics, biogenesis, mechanism, and function. Cell 116:281–297 - PubMed
    1. Young LS, Rickinson AB. 2004. Epstein-Barr virus: 40 years on. Nat. Rev. Cancer 4:757–768 - PubMed
    1. Young LS, Murray PG. 2003. Epstein-Barr virus and oncogenesis: from latent genes to tumours. Oncogene 22:5108–5121 - PubMed
    1. Middeldorp JM, Brink AA, van den Brule AJ, Meijer CJ. 2003. Pathogenic roles for Epstein-Barr virus (EBV) gene products in EBV-associated proliferative disorders. Crit. Rev. Oncol. Hematol. 45:1–36 - PubMed
    1. van Beek J, Brink AA, Vervoort MB, van Zijp MJ, Meijer CJ, van den Brule AJ, Middeldorp JM. 2003. In vivo transcription of the Epstein-Barr virus (EBV) BamHI-A region without associated in vivo BARF0 protein expression in multiple EBV-associated disorders. J. Gen. Virol. 84:2647–2659 - PubMed

Publication types

MeSH terms