. 2013 Jul;87(14):7977-91.
doi: 10.1128/JVI.03540-12. Epub 2013 May 15.

Molecular determinants of hepatitis B and D virus entry restriction in mouse sodium taurocholate cotransporting polypeptide

Affiliations

Molecular determinants of hepatitis B and D virus entry restriction in mouse sodium taurocholate cotransporting polypeptide

Huan Yan et al. J Virol. 2013 Jul.

Erratum in

Abstract

Human hepatitis B virus (HBV) and its satellite virus, hepatitis D virus (HDV), primarily infect humans, chimpanzees, or tree shrews (Tupaia belangeri). Viral infections in other species are known to be mainly restricted at the entry level since viral replication can be achieved in the cells by transfection of the viral genome. Sodium taurocholate cotransporting polypeptide (NTCP) is a functional receptor for HBV and HDV, and amino acids 157 to 165 of NTCP are critical for viral entry and likely limit viral infection of macaques. However, the molecular determinants for viral entry restriction in mouse NTCP (mNTCP) remain unclear. In this study, mNTCP was found to be unable to support either HBV or HDV infection, although it can bind to pre-S1 of HBV L protein and is functional in transporting substrate taurocholate; comprehensive swapping and point mutations of human NTCP (hNTCP) and mNTCP revealed molecular determinants restricting mNTCP for viral entry of HBV and HDV. Remarkably, when mNTCP residues 84 to 87 were substituted by human counterparts, mNTCP can effectively support viral infections. In addition, a number of cell lines, regardless of their species or tissue origin, supported HDV infection when transfected with hNTCP or mNTCP with residues 84 to 87 replaced by human counterparts, highlighting the central role of NTCP for viral infections mediated by HBV envelope proteins. These studies advance our understanding of NTCP-mediated viral entry of HBV and HDV and have important implications for developing the mouse model for their infections.


Figures
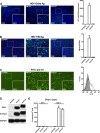
Fig 1
Fig 1
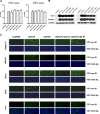
mNTCP does not support HBV and HDV infection but is capable of pre-S1 binding. (A) HepG2 cells were transfected with human or mouse NTCP or a pcDNA6 vector control. Transfected cells were maintained in PMM for 24 h and then inoculated with 500 multiplicities of genome equivalents (mge) of HDV in the presence of 5% PEG8000. Intracellular HDV delta antigen, mainly in the nucleus, was detected by FITC-conjugated MAb 4G5 at 8 days postinfection (dpi). Cell nuclei were stained with DAPI in blue (left). HDV RNA copy numbers were measured by real-time reverse transcription-PCR (RT-PCR) and presented as HDV RNA copies per cell (right). (B) HepG2 cells were transfected as in panel A and infected with 100 mge of HBV in the presence of 5% PEG8000. At 8 dpi, intracellular HBV core antigen was stained with MAb 1C10 in green. Nuclei were stained with DAPI in blue (left). Secreted HBeAg in the supernatant was measured with commercial ELISA kit. A dotted line indicates the detection limit (right). (C) Human and mouse NTCP bound to pre-S1 lipopeptide. HepG2 cells were transfected as in panel A and were maintained in PMM for 24 h before staining with 400 nM FITC-labeled lipopeptide corresponding to the N-terminal 59 aa of pre-S1 (FITC-pre-S1) at 37°C for 3 h. Cells were washed extensively with culture medium to remove excess free peptide before visualization (left), or cells were detached by 5 mM EDTA-PBS, and the FITC-pre-S1 association was analyzed by flow cytometry (right). Shading indicates the pcDNA6 vector, the dotted line indicates mNTCP, and the solid line indicates hNTCP. Mean fluorescence of pre-S1 binding: vector, 13.66; mNTCP, 35.33; hNTCP, 67.99. (D) HepG2 cells were transfected as in panel A, and the total and cell surface NTCP expression were examined at 24 to 36 h posttransfection. For the total NTCP expression levels (upper panel), cell lysates were treated with PNGase F and separated by SDS-PAGE, followed by Western blotting with 1D4, which recognizes a C9 tag added to the C terminus of NTCP molecules. For the cell surface NTCP expression levels (middle panel), surface proteins were biotinylated and pulled down with streptavidin T1 Dynabeads. NTCP surface expression was then examined by Western blotting with MAb 1D4. The expression of GAPDH in the cell lysates is shown (bottom panel) as an internal control. (E) Uptake of [3H]taurocholate ([3H]TC) by HepG2 cells transfected with human NTCP, mouse NTCP, or vector pcDNA6. HepG2 cells were transfected and then cultured in PMM for 24 h. Cells were incubated at 37°C for 15 min with 1 μM [3H]taurocholate diluted in Na+ Ringer solution or choline+ Ringer solution without Na+. Intracellular accumulation of [3H]taurocholate was determined by scintillation counting. The uptake efficiency is presented as counts per 100,000 HepG2 cells per min.
Fig 2
Fig 2
Exchange of the cytosolic tails of mouse and human NTCPs did not alter their abilities to support HDV infection. (A) NTCPs from human, crab-eating monkey, tupaia, or mouse (GenBank accession nos. NM003049, XM001110268, JQ608471, and NM001177561) were aligned using ClustalW2. Blue bars indicate transmembrane domains that were predicted by alignment of human NTCP with NTCPs from other species and were based on the crystal structure of a bacterial homologue of the bile acid sodium symporter ASBTNM with small modifications. The boxed residues (aa 84 to 87, solid line; aa 157 to 165, dotted line) indicate motifs that are crucial for FITC-pre-S1 binding and viral infections. (B) Human NTCP, mouse NTCP, pcDNA6 vector, hNTCP with aa 300 to 362 cytosolic tail of mNTCP (hNTCP-m-tail), or mNTCP with aa 300 to 349 cytosolic tail of hNTCP (mNTCP-h-tail) were transfected in Huh-7 cells and cultured in PMM for 24 h. The cells were incubated with 400 nM FITC-pre-S1 peptide at 37°C for 3 h and then imaged after extensive washing (upper panels), or the cells were inoculated with 500 mge of HDV at 37°C for 24 h in the presence of 5% PEG8000, the HDV delta antigen in infected cells was detected with FITC-conjugated MAb 4G5 at 8 dpi, and the cell nuclei were counterstained with DAPI (blue, lower panels).
Fig 3
Fig 3
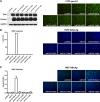
HBV and HDV entry is primarily restricted by a region of mNTCP containing 95 residues. (A) Schematic diagram of chimeric NTCP proteins (upper panel, left). hNTCP (dark gray) and mNTCP (light gray) were divided into five parts (A to E) based on sequence alignment and topology prediction (30). Swap chimeras of hNTCP and mNTCP were generated by stepwise exchange of these domains for loss-of-function and gain-of-function assays. Western blot analysis of the total and surface expression levels of different NTCP chimeras in transfected HepG2 cells was performed. GAPDH protein was used as an internal control (lower panel, left). The cells were incubated with 400 nM FITC-pre-S1 peptide at 37°C for 3 to 4 h, and images were captured with a Nikon Eclipse Ti fluorescence microscope after extensive washes with culture medium (right). (B) HDV infection mediated by NTCP chimeras. HepG2 cells transfected with NTCP chimeras were infected with 500 mge of HDV particles in the presence of 5% PEG8000. At 8 dpi, HDV delta antigen was stained with FITC-conjugated MAb 4G5 (right). Images were analyzed by Columbus Image Data Storage and Analysis System, and the ratio of infected cells was calculated as the ratio of delta antigen-positive dots to the number of nuclei. Infectivity was presented as percentage of HDV infection on wild-type hNTCP (left). (C) HBV infection mediated by NTCP chimeras. HepG2 cells were transfected as in panel B and inoculated with 100 mge of HBV particles in the presence of 5% PEG8000. Secreted HBeAg in the supernatant was measured at 6 dpi with a commercial ELISA kit; the dotted line indicates the detection limit (left). At 7 dpi, the cells were stained with 5 μg of HBcAg-specific MAb 1C10/ml. Cell nuclei were stained with DAPI in blue. Representative pictures of the infections were shown (right).
Fig 4
Fig 4
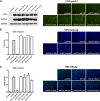
Substitution of the 95 residues fragment of mNTCP with hNTCP counterpart converts mNTCP a functional receptor on HepG2 cells. (A) Schematic diagram of chimeric NTCP proteins (upper panel, left): hNTCP (dark gray) and mNTCP (light gray). Western blot analysis of the total and surface expression levels of different NTCP chimeras in transfected HepG2 cells was performed. GAPDH protein was used as an internal control (lower panel, left). Cells were incubated with 400 nM FITC-pre-S1 peptide at 37°C for 3 to 4 h, and images were captured after extensive washes with culture medium (right). (B) HDV infection mediated by NTCP chimeras. HepG2 cells transfected with NTCP chimeras were infected with 500 mge of HDV particles in the presence of 5% PEG8000. At 8 dpi, the HDV delta antigen was stained with MAb 4G5 in green (right). The ratio of infected cells were evaluated as the ratio of delta antigen-positive dots to the number of nuclei. Infectivity is presented as the percentage of HDV infection on wild-type hNTCP (left). (C) HBV infection mediated by NTCP chimeras. HepG2 cells were transfected as in panel B and were inoculated with 100 mge of HBV particles in the presence of 5% PEG8000. Secreted HBeAg in the supernatant was measured at 6 dpi, and the dotted line indicates the detection limit (left). At 7 dpi, the cells were stained with 1C10 in green. Representative pictures of the infections are shown (right).
Fig 5
Fig 5
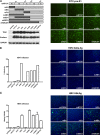
Residues 84 to 87 of mNTCP compose a key motif limiting viral infection. (A) Western blot analysis of the total and surface expression levels of NTCP in HepG2 cells transfected with NTCP variants. The GAPDH level in the cell lysates was used as an internal control (left). Cells were incubated with 400 nM FITC-pre-S1 peptide at 37°C for 3 to 4 h, and images were captured with a Nikon Eclipse Ti fluorescence microscope after extensive washes with culture medium (right). (B) HDV infection mediated by NTCP variants. HepG2 cells transfected as in panel A were infected with 500 mge of HDV, and the delta antigen was stained with FITC-labeled 4G5 at 8 dpi (right). Images were analyzed by Columbus software, and the ratio of infected cells were evaluated as the ratio of delta antigen-positive dots to the number of nuclei. Infectivity is presented as the percentage of HDV infection on wild-type hNTCP (left). (C) HBV infection mediated by NTCP variants. HepG2 cells transfected as in panel A were inoculated with 100 mge of HBV in the presence of 5% PEG8000. Secreted HBeAg in the supernatant was measured at 6 dpi with ELISA, and a dotted line indicates the detection limit (left). At 7 dpi, HBcAg was stained with MAb 1C10 in green. Cell nuclei were stained with DAPI in blue. Representative pictures of the infections are shown (right).
Fig 6
Fig 6
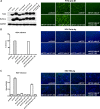
mNTCP bearing residues 84 to 87 from hNTCP supports viral entry on HepG2 cells. (A) Western blot analysis of the total and surface expression levels of NTCP in HepG2 cells transfected with NTCP variants. The GAPDH level in the cell lysates was used as an internal control (left). The cells were incubated with 400 nM FITC-pre-S1 peptide at 37°C for 3 to 4 h before images were recorded (right). (B) HDV infection mediated by NTCP variants. HepG2 cells transfected with the indicated NTCP variants were infected with 500 mge of HDV, and the delta antigen was stained with 4G5 in green at 8 dpi (right). Images were analyzed by Columbus software, and the ratio of infected cells was calculated as the ratio of delta antigen-positive dots to the number of nuclei. Infectivity is presented as the percentage of HDV infection on wild-type hNTCP (left). (C) HBV infection mediated by NTCP variants. HepG2 cells transfected as in panel B were inoculated with 100 mge of HBV in the presence of 5% PEG8000. Secreted HBeAg was measured at 6 dpi with ELISA, and the dotted line indicates the detection limit (left). At 7 dpi, cells were stained with 1C10 for HBcAg in green. Cell nuclei were in blue. Representative pictures of the infections were shown (right).
Fig 7
Fig 7
Contributions of the individual residues within aa 84 to 87 motif for NTCP as a viral receptor. (A) HepG2 cells transfected with NTCP variant bearing one or a few mutations within the aa 84 to 87 motif were cultured in PMM for 24 h. The uptake of [3H]taurocholate ([3H]TC) was quantified by scintillation counting and is presented as the percentage of that of hNTCP for hNTCP variants or as a percentage of that of mNTCP for mNTCP variants. (B) HepG2 cells were transfected as in panel A, and the total and surface expression levels of the NTCPs were examined by Western blotting. The level of GAPDH was used as an internal control. The data are presented as relative scintillation counts compared to hNTCP (left) or mNTCP (right). (C) HepG2 cells were transfected as in panel A and then stained with 400 nM FITC-pre-S1 at 37°C for 3 h before image recording. (D and E) HepG2 cells transfected as in panel A and then inoculated with 500 mge of HDV or 100 mge of HBV. (D) Secreted HBeAg in the supernatant were determined at 7 dpi with ELISA. (E) At 8 dpi, intracellular delta antigens were analyzed by staining with FITC-conjugated 4G5, quantified by Columbus software, and was presented as a percentage of infectivity of HDV on hNTCP.
Fig 8
Fig 8
Amino acids 84 to 87 and aa 157 to 165 of NTCP are both required for HBV and HDV infection. (A) HepG2 cells were transfected with human NTCP, mouse NTCP, a pcDNA6 vector control, or NTCP variants as indicated and maintained in PMM for 24 h. The total and surface expression levels of different NTCP variants in transfected HepG2 cells were determined by Western blotting. GAPDH was used as an internal control (left). Other cells were stained with 400 nM FITC-pre-S1 peptide at 37°C for 3 h, followed by extensive washings, and then recorded (right). (B and C) HepG2 cells were transfected as in panel A and cultured in PMM for 24 h, followed by inoculation with 500 mge of HDV or 100 mge of HBV. (B) At 8 dpi, HDV infection, as indicated by intracellular delta antigens staining with FITC-conjugated 4G5 (right), was quantified by Columbus software and is presented as a percentage of the infectivity of HDV on hNTCP (left). (C) Secreted HBeAg in the supernatants was determined with ELISA (left), and intracellular core antigen was stained by 1C10 at 7 dpi (right).
Fig 9
Fig 9
NTCP confers cells from different tissue and species susceptibility for HDV infection. (A) Mouse hepatocellular carcinoma cells (Hepa1-6) were transfected with human NTCP, mouse NTCP, pcDNA6 vector, or mutant NTCPs as indicated and cultured in PMM for 24 h, followed by incubation with 1 μM [3H]taurocholate ([3H]TC) in Na+ Ringer solution at 37°C for 15 min. The uptake of [3H]taurocholate was determined by scintillation counting and is presented as a percentage of that of hNTCP (left) or mNTCP (right). (B) Hepa1-6 cells were transfected as in panel A, and then the total and surface expression levels of NTCPs were examined by Western blotting. GAPDH was used as an internal control. (C) Hepa1-6 cells, mouse hepatocarcinoma cells (MMHD3), human cervical carcinoma cells (HeLa), Chinese hamster ovary cells (CHO), and African green monkey kidney cells (Vero) were transfected with human NTCP, mouse NTCP, human NTCP variant hNTCP-m84-87, mouse NTCP variant mNTCP-h84-87, or pcDNA6 vector as indicated and cultured in PMM for 24 h. The cells were stained with FITC-pre-S1 peptide or infected with 500 mge of HDV. For peptide staining, the cells were incubated with 400 nM FITC-pre-S1 peptide at 37°C for 3 h and then imaged after extensive wash (upper panel in each group). HDV delta antigen in infected cells was detected with FITC-conjugated MAb 4G5 at 8 dpi (lower panel in each group).

References

    1. Ganem D, Prince AM. 2004. Hepatitis B virus infection: natural history and clinical consequences. N. Engl. J. Med. 350:1118–1129 - PubMed
    1. Lavanchy D. 2004. Hepatitis B virus epidemiology, disease burden, treatment, and current and emerging prevention and control measures. J. Viral Hepat. 11:97–107 - PubMed
    1. Chan HL, Sung JJ. 2006. Hepatocellular carcinoma and hepatitis B virus. Semin. Liver Dis. 26:153–161 - PubMed
    1. Hughes SA, Wedemeyer H, Harrison PM. 2011. Hepatitis delta virus. Lancet 378:73–85 - PubMed
    1. Nassal M. 1996. Hepatitis B virus morphogenesis. Curr. Top. Microbiol. Immunol. 214:297–337 - PubMed

Publication types

MeSH terms

Substances