. 2013 May 16:14:55.
doi: 10.1186/1471-2202-14-55.

Basal forebrain activation controls contrast sensitivity in primary visual cortex

Affiliations

Basal forebrain activation controls contrast sensitivity in primary visual cortex

Anwesha Bhattacharyya et al. BMC Neurosci. .

Abstract

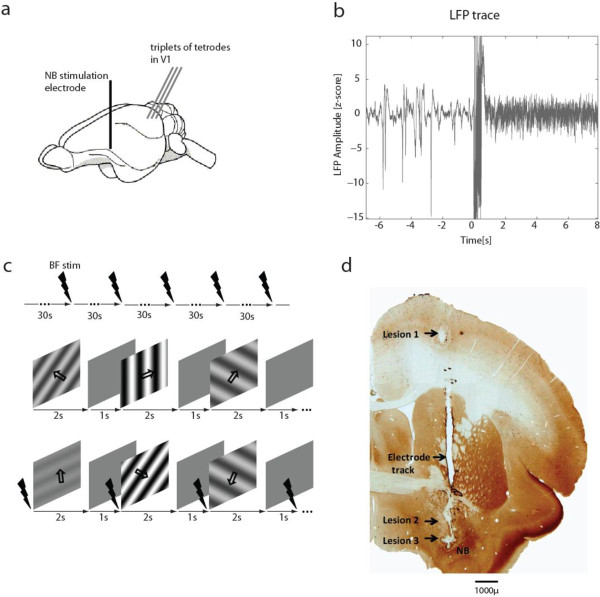
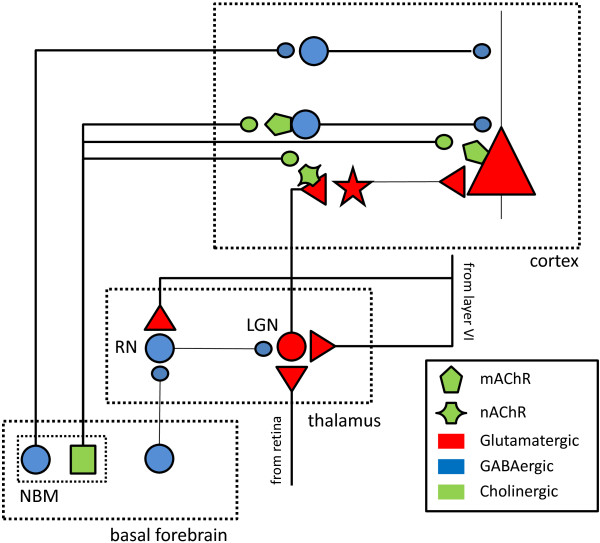
Background: The basal forebrain (BF) regulates cortical activity by the action of cholinergic projections to the cortex. At the same time, it also sends substantial GABAergic projections to both cortex and thalamus, whose functional role has received far less attention. We used deep brain stimulation (DBS) in the BF, which is thought to activate both types of projections, to investigate the impact of BF activation on V1 neural activity.

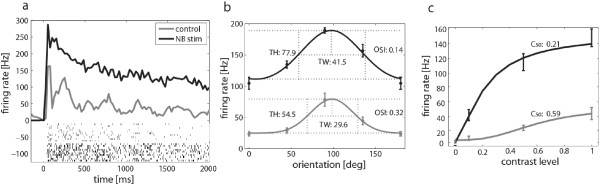
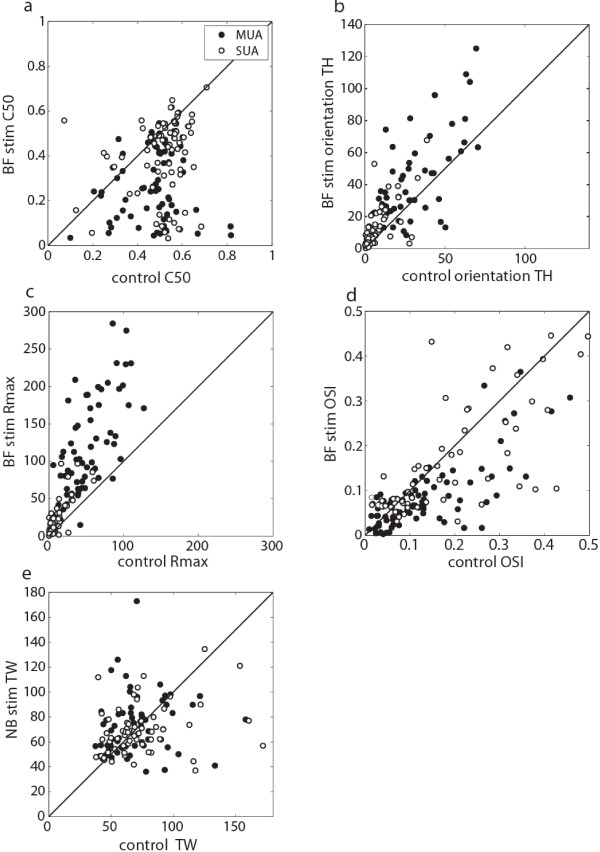
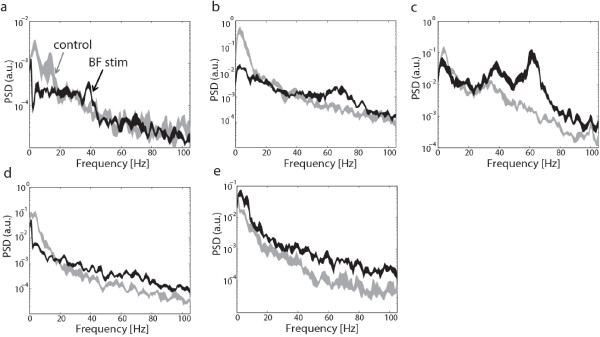
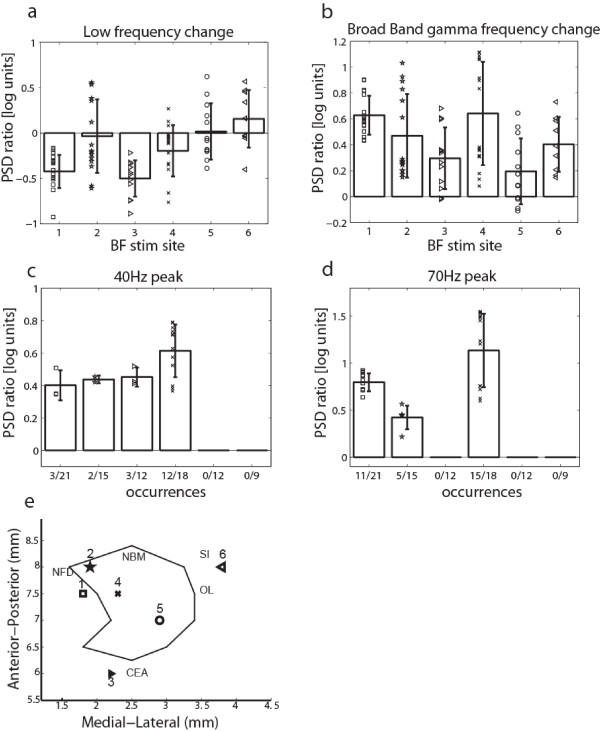
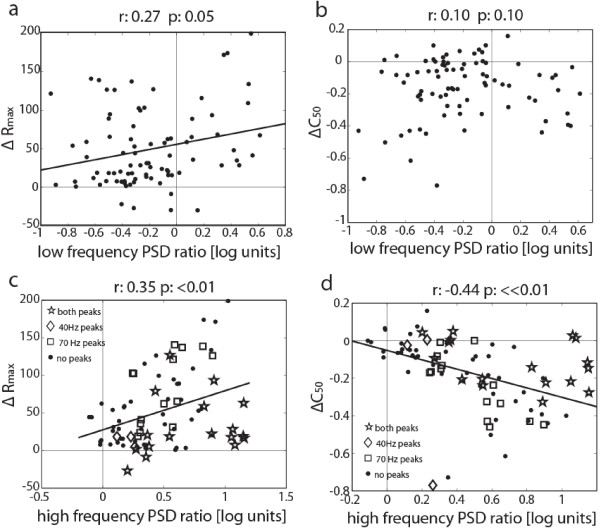
Results: BF stimulation robustly increased V1 single and multi-unit activity, led to moderate decreases in orientation selectivity and a remarkable increase in contrast sensitivity as demonstrated by a reduced semi-saturation contrast. The spontaneous V1 local field potential often exhibited spectral peaks centered at 40 and 70 Hz as well as reliably showed a broad γ-band (30-90 Hz) increase following BF stimulation, whereas effects in a low frequency band (1-10 Hz) were less consistent. The broad γ-band, rather than low frequency activity or spectral peaks was the best predictor of both the firing rate increase and contrast sensitivity increase of V1 unit activity.

Conclusions: We conclude that BF activation has a strong influence on contrast sensitivity in V1. We suggest that, in addition to cholinergic modulation, the BF GABAergic projections play a crucial role in the impact of BF DBS on cortical activity.


Figures

Figure 1
Figure 1
Experimental design and procedure. (a) Schematic representation of the lateral view of a tree shrew brain showing the position of the stimulation electrode in the basal forebrain (BF) and the three tetrodes used for recording from primary visual cortex (V1). (b) Sample time course showing the effect of BF stimulation on spontaneous V1 LFP. Large amplitude, slow fluctuations change to a higher frequency oscillation. (c) Experimental Paradigm: The upper panel represents the “BF stim only” protocol used for measuring the effects of BF stimulation on the spontaneous LFP spectrum. The middle and lower panel represent the “BF stim grating” protocols where drifting sinusoidal gratings of different contrasts and orientations were presented, without (middle) and with interleaved BF stimulation (lower panel). The time point of BF stimulation is represented by a black arrow. (d) A cytochrome oxidase stained coronal section showing the electrode track and electrolytic lesions at 3 different depths (8200, 7200 and 1000 μm). The lowest lesion, in the region of NBM, was at the final position of the stimulation electrode.
Figure 2
Figure 2
Example unit, showing increased orientation tuning and contrast sensitivity following BF stimulation. (a) Peri-stimulus time histogram (25 ms binning) and raster plot, showing that BF stimulation led to a robust increase in firing rate (b) A wrapped Gaussian fit to the mean firing rate for each orientation is shown. Values of the tuning width (TW) and tuning height (TH), as well as the orientation selectivity index (OSI) are shown next to the corresponding curve. BF stimulation increased TH and TW parameters while decreasing the OSI. (c) A Naka-Rushton function was fit to the contrast response data to determine the semi saturation contrast (C50 ) as a measure of contrast sensitivity. BF stimulation decreased the C50 and thus enhanced contrast sensitivity.
Figure 3
Figure 3
Population data for BF stimulation effects on orientation and contrast parameters of MUA and SUA. MUA sites are plotted as filled circles, SUA as open circles (a) contrast sensitivity is increased by BF stim (decreased C50 values) (b) values for both tuning height (TH) and (c) baseline-subtracted peak firing rate (Rmax) are increased (d) the Orientation selectivity index (OSI) is significantly decreased while (e) there is no systematic effect on tuning width (TW).
Figure 4
Figure 4
Examples of V1 LFP power spectral density (PSD) changes triggered by BF stim. The gray and black traces represent the PSD ± SEM before and after BF stimulation respectively. The different panels represent examples for the different observed patterns: (a) 40Hz γ-band peak (b) 70Hz γ-band peak (c) Both 40Hz and 70Hz γ-band peaks (d) Decrease in the low frequency (0–10Hz) band and broad increase in the γ-band. (e) Increase in both low and high frequency band, no peaks.
Figure 5
Figure 5
Spectral V1 LFP effects for different BF stimulation sites. The bar plots show the average LFP PSD ratio in log units between BF stimulation and control condition, separately for each BF site. Error bars: SD. The different symbols represent spectral changes at multiple V1 recording sites for each respective BF site. (a) Low frequency band effects were variable, with 3/6 sites showing significant reductions. (b) The broad γ-band showed a significant increase for all BF sites. (c) A 40Hz peak was seen in 4/6 BF sites. The number of V1 locations at each site exhibiting the 40Hz peak is shown below each bar plot. (d) A 70Hz peak was observed in 3/6 experiments. (e) Schematic representation of the BF stimulation sites in a horizontal projection. Each site is represented by a unique symbol and a corresponding number. The black outline shows the approximate boundary of the NBM. Structures adjacent to the NB are marked in their approximate locations: NFD: Nucleus fasciculi diagonalis Brocae; SI: Substantia Inominata; OL: Nucleus tractus olfactorii lateralis; CEA: Nucleus Centralis Amygdalae.
Figure 6
Figure 6
Relationship between LFP PSD ratios and contrast response changes of V1. MUA Rmax changes (Δ Rmax) were significantly correlated with both (a) low and (c) high frequency changes. Semi-saturation contrast changes (ΔC50) were (b) uncorrelated with low frequency changes but (d) showed a strong negative correlation with γ-band changes. The large symbols in (c) and (d) denote the recording locations showing either a 70 Hz peak (square), a 40 Hz peak (diamond), both peaks (star) or no peaks (dot). Correlation coefficients (r) and p-values are given on top of each plot.
Figure 7
Figure 7
Simplified representation of BF, cortical and thalamic circuitry illustrating possible mechanisms of observed effects of BF stimulation. Cholinergic neurons in the NBM can influence cortical activity through either muscarinic receptors (mAChRs) located on both pyramidal neurons as well as inhibitory interneurons or through nicotinic receptors (nAChRs) located mostly presynaptically on the thalamocortical terminals. GABAergic neurons of the NBM also project to the cortex where they preferentially target other GABAergic interneurons. The effect of stimulating these neurons would thus mediate disinhibition in cortex. Another population of GABAergic neurons in the BF innervates the thalamic reticular nucleus, where - by a similar disinhibitory mechanism - they could enhance sensory signals relayed by the LGN from the retina to the cortex. Feedback connections from cortex to the LGN, which may contribute to BF stimulation related regulation of activity, are also shown.

Similar articles

Cited by

References

    1. Lehmann J, Nagy JI, Atmadia S, Fibiger HC. The nucleus basalis magnocellularis: the origin of a cholinergic projection to the neocortex of the rat. Neuroscience. 1980;5(7):1161–1174. doi: 10.1016/0306-4522(80)90195-5. - DOI - PubMed
    1. Mesulam MM, Mufson EJ, Levey AI, Wainer BH. Cholinergic innervation of cortex by the basal forebrain: cytochemistry and cortical connections of the septal area, diagonal band nuclei, nucleus basalis (substantia innominata), and hypothalamus in the rhesus monkey. J Comp Neurol. 1983;214(2):170–197. doi: 10.1002/cne.902140206. - DOI - PubMed
    1. Baxter MG, Chiba AA. Cognitive functions of the basal forebrain. Curr Opin Neurobiol. 1999;9(2):178–183. doi: 10.1016/S0959-4388(99)80024-5. - DOI - PubMed
    1. Deco G, Thiele A. Attention: oscillations and neuropharmacology. Eur J Neurosci. 2009;30(3):347–354. doi: 10.1111/j.1460-9568.2009.06833.x. - DOI - PMC - PubMed
    1. Hasselmo ME, Sarter M. Modes and models of forebrain cholinergic neuromodulation of cognition. Neuropsychopharmacology. 2011;36(1):52–73. doi: 10.1038/npp.2010.104. - DOI - PMC - PubMed

Publication types

LinkOut - more resources