

Torsional stiffness and strength of the proximal tibia are better predicted by finite element models than DXA or QCT
- PMID: 23680350
- PMCID: PMC3676700
- DOI: 10.1016/j.jbiomech.2013.04.016
Torsional stiffness and strength of the proximal tibia are better predicted by finite element models than DXA or QCT
Abstract
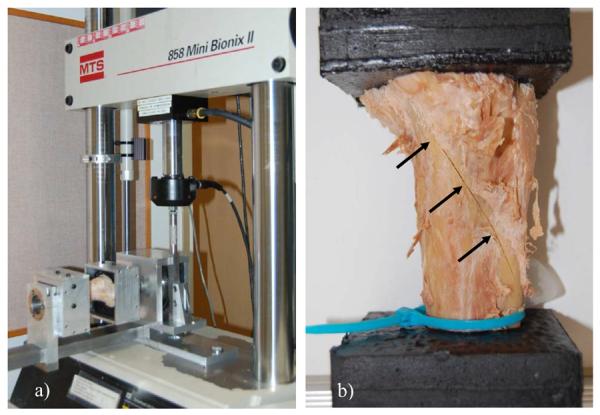
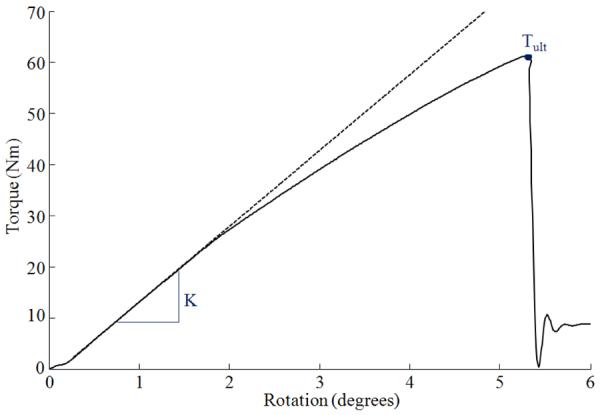
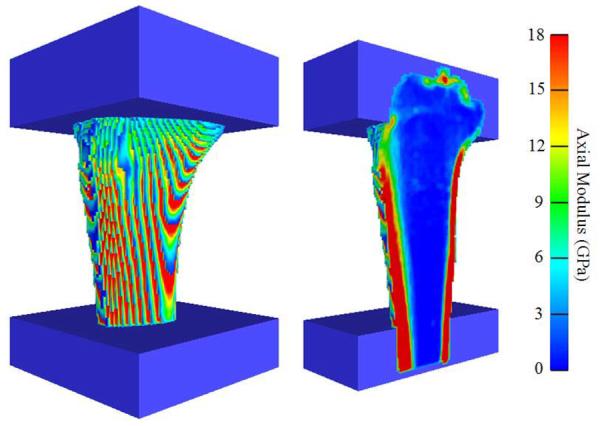
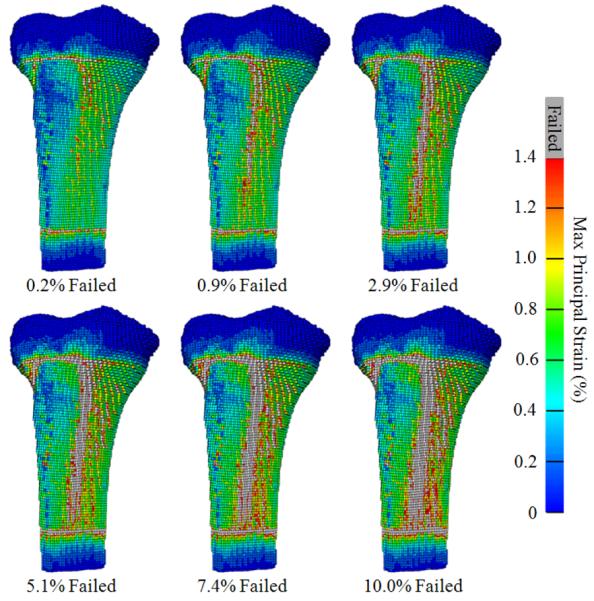
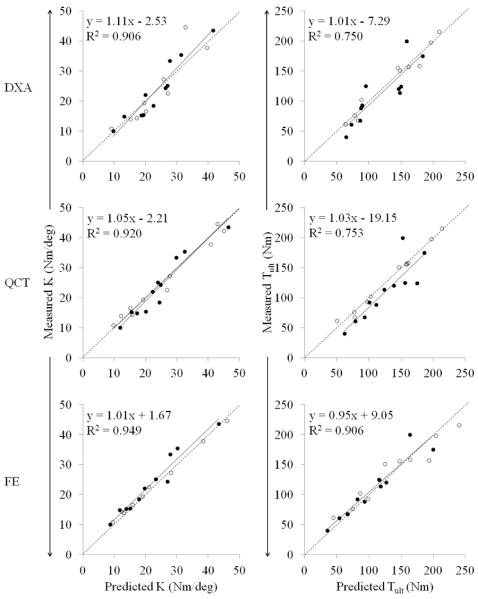
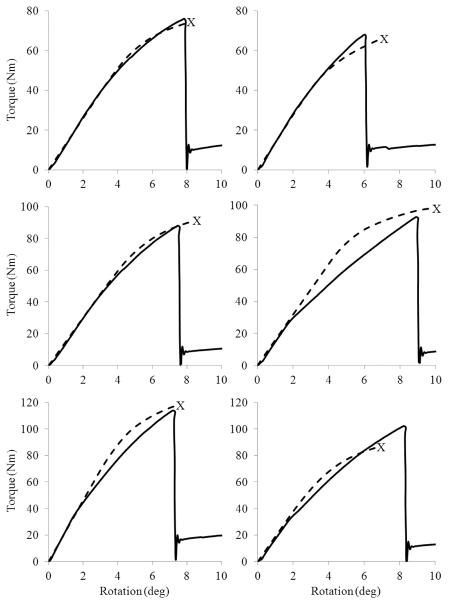
Individuals with spinal cord injury experience a rapid loss of bone mineral below the neurological lesion. The clinical consequence of this bone loss is a high rate of fracture around regions of the knee. The ability to predict the mechanical competence of bones at this location may serve as an important clinical tool to assess fracture risk in the spinal cord injury population. The purpose of this study was to develop, and statistically compare, non-invasive methods to predict torsional stiffness (K) and strength (Tult) of the proximal tibia. Twenty-two human tibiae were assigned to either a "training set" or a "test set" (11 specimens each) and mechanically loaded to failure. The training set was used to develop subject-specific finite element (FE) models, and statistical models based on dual energy x-ray absorptiometry (DXA) and quantitative computed tomography (QCT), to predict K and Tult; the test set was used for cross-validation. Mechanical testing produced clinically relevant spiral fractures in all specimens. All methods were accurate and reliable predictors of K (cross-validation r(2)≥0.91; error≤13%), however FE models explained an additional 15% of the variance in measured Tult and illustrated 12-16% less error than DXA and QCT models. Given the strong correlations between measured and FE predicted K (cross-validation r(2)=0.95; error=10%) and Tult (cross-validation r(2)=0.91; error=9%), we believe the FE modeling procedure has reached a level of accuracy necessary to answer clinically relevant questions.
Copyright © 2013 Elsevier Ltd. All rights reserved.
Figures
Similar articles
-
Stiffness and Strength Predictions From Finite Element Models of the Knee are Associated with Lower-Limb Fractures After Spinal Cord Injury.Ann Biomed Eng. 2021 Feb;49(2):769-779. doi: 10.1007/s10439-020-02606-w. Epub 2020 Sep 14. Ann Biomed Eng. 2021. PMID: 32929557
-
Femoral strength is better predicted by finite element models than QCT and DXA.J Biomech. 1999 Oct;32(10):1013-20. doi: 10.1016/s0021-9290(99)00099-8. J Biomech. 1999. PMID: 10476839
-
QCT-based finite element models predict human vertebral strength in vitro significantly better than simulated DEXA.Osteoporos Int. 2012 Feb;23(2):563-72. doi: 10.1007/s00198-011-1568-3. Epub 2011 Feb 23. Osteoporos Int. 2012. PMID: 21344244
-
Predicting bone strength from CT data: Clinical applications.Morphologie. 2019 Dec;103(343):180-186. doi: 10.1016/j.morpho.2019.09.007. Epub 2019 Oct 17. Morphologie. 2019. PMID: 31630964 Review.
-
Are CT-Based Finite Element Model Predictions of Femoral Bone Strength Clinically Useful?Curr Osteoporos Rep. 2018 Jun;16(3):216-223. doi: 10.1007/s11914-018-0438-8. Curr Osteoporos Rep. 2018. PMID: 29656377 Free PMC article. Review.
Cited by
-
Stiffness and Strength Predictions From Finite Element Models of the Knee are Associated with Lower-Limb Fractures After Spinal Cord Injury.Ann Biomed Eng. 2021 Feb;49(2):769-779. doi: 10.1007/s10439-020-02606-w. Epub 2020 Sep 14. Ann Biomed Eng. 2021. PMID: 32929557
-
Evaluating differences in Young's Modulus of regenerated and uninjured mouse digit bone through microCT density-based calculation and nanoindentation testing.J Biomech. 2022 Oct;143:111271. doi: 10.1016/j.jbiomech.2022.111271. Epub 2022 Aug 27. J Biomech. 2022. PMID: 36095912 Free PMC article.
-
Simulation-based prediction of bone healing and treatment recommendations for lower leg fractures: Effects of motion, weight-bearing and fibular mechanics.Front Bioeng Biotechnol. 2023 Feb 20;11:1067845. doi: 10.3389/fbioe.2023.1067845. eCollection 2023. Front Bioeng Biotechnol. 2023. PMID: 36890916 Free PMC article.
-
Bone fragility after spinal cord injury: reductions in stiffness and bone mineral at the distal femur and proximal tibia as a function of time.Osteoporos Int. 2018 Dec;29(12):2703-2715. doi: 10.1007/s00198-018-4733-0. Epub 2018 Oct 17. Osteoporos Int. 2018. PMID: 30334093 Free PMC article. Clinical Trial.
-
Finite element analysis of bone strength in osteogenesis imperfecta.Bone. 2020 Apr;133:115250. doi: 10.1016/j.bone.2020.115250. Epub 2020 Jan 22. Bone. 2020. PMID: 31981754 Free PMC article. Review.
References
-
- Ashman RB, Rho JY, Turner CH. Anatomical variation of orthotropic elastic moduli of the proximal human tibia. Journal of Biomechanics. 1989;22:895–900. - PubMed
-
- Bayraktar HH, Morgan EF, Niebur GL, Morris GE, Wong EK, Keaveny TM. Comparison of the elastic and yield properties of human femoral trabecular and cortical bone tissue. Journal of Biomechanics. 2004;37:27–35. - PubMed
-
- Bessho M, Ohnishi I, Matsuyama J, Matsumoto T, Imai K, Nakamura K. Prediction of strength and strain of the proximal femur by a CT-based finite element method. Journal of Biomechanics. 2007;40:1745–1753. - PubMed
-
- Biering-Sorensen F, Bohr HH, Schaadt OP. Longitudinal study of bone mineral content in the lumbar spine, the forearm and the lower extremities after spinal cord injury. European Journal of Clinical Investigation. 1990;20:330–335. - PubMed
Publication types
MeSH terms
Grants and funding
LinkOut - more resources
Full Text Sources
Other Literature Sources
