. 2013 Aug;84(2):190-200.
doi: 10.1124/mol.113.085175. Epub 2013 May 16.

D1-D2 dopamine receptor synergy promotes calcium signaling via multiple mechanisms

Affiliations

D1-D2 dopamine receptor synergy promotes calcium signaling via multiple mechanisms

Lani S Chun et al. Mol Pharmacol. 2013 Aug.

Abstract

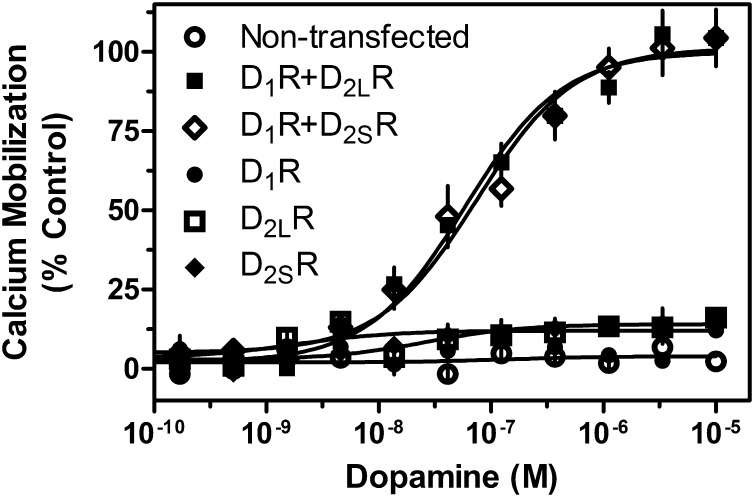
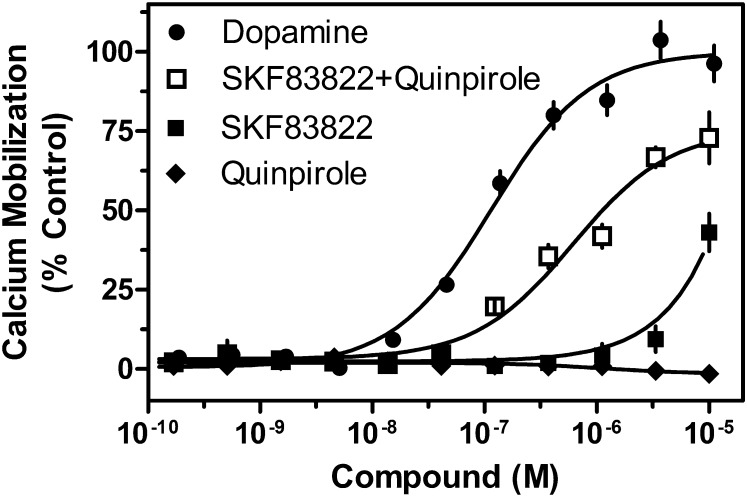
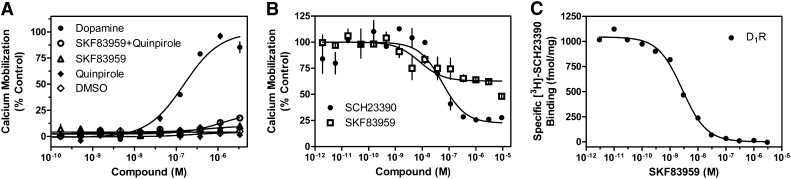
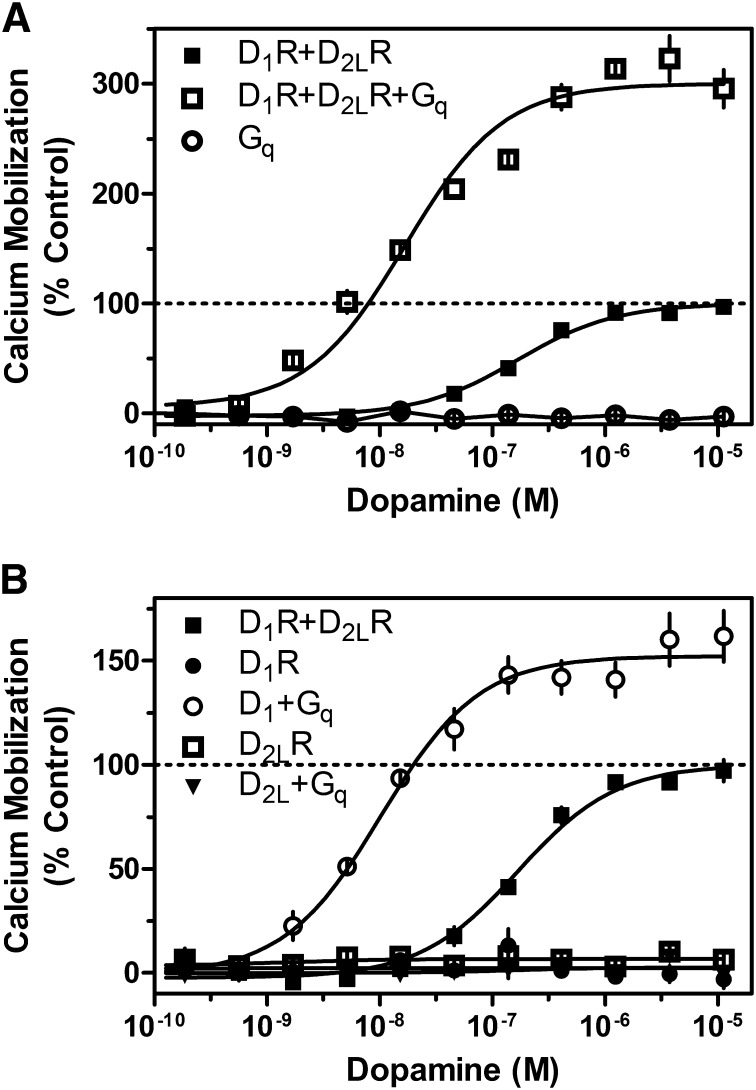
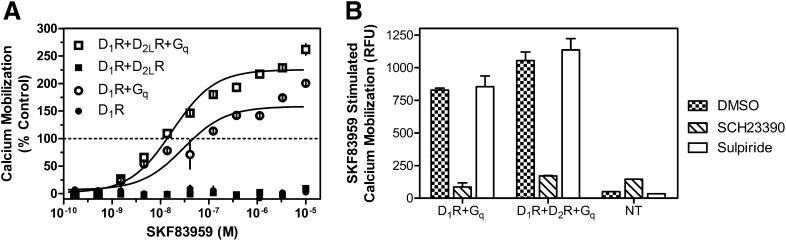
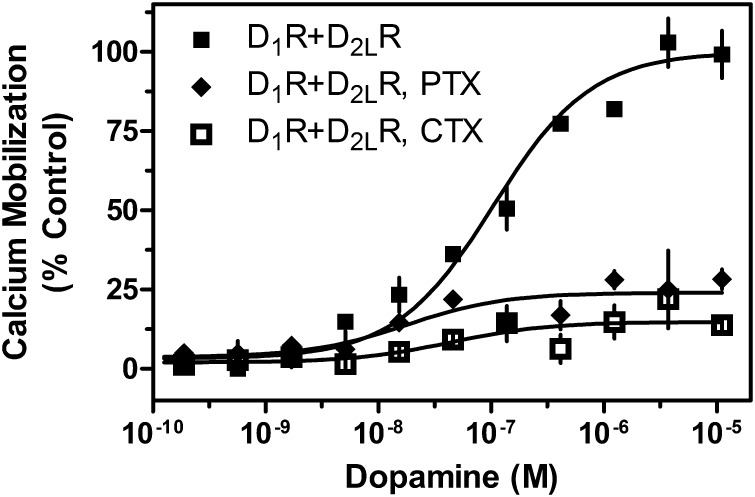
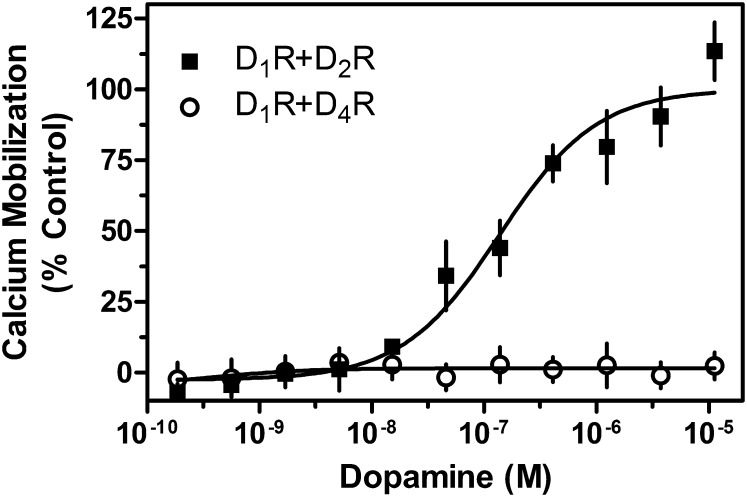
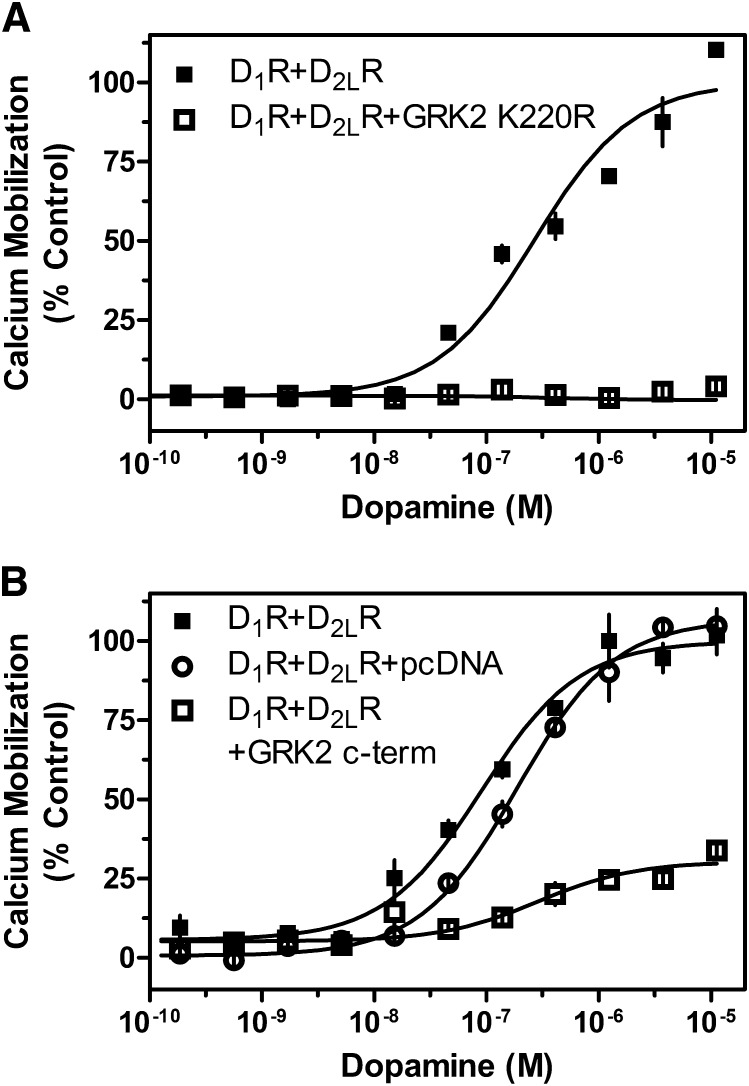
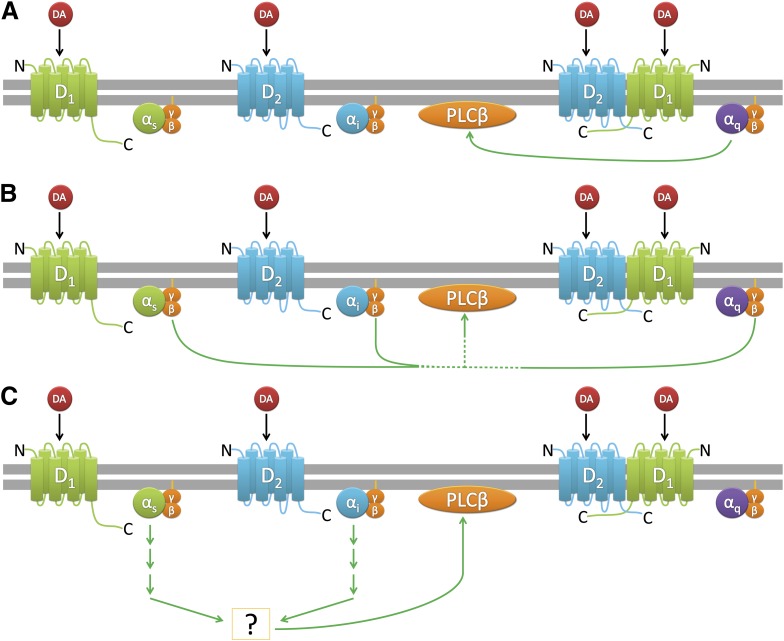
The D(1) dopamine receptor (D(1)R) has been proposed to form a hetero-oligomer with the D(2) dopamine receptor (D(2)R), which in turn results in a complex that couples to phospholipase C-mediated intracellular calcium release. We have sought to elucidate the pharmacology and mechanism of action of this putative signaling pathway. Dopamine dose-response curves assaying intracellular calcium mobilization in cells heterologously expressing the D(1) and D(2) subtypes, either alone or in combination, and using subtype selective ligands revealed that concurrent stimulation is required for coupling. Surprisingly, characterization of a putative D(1)-D(2) heteromer-selective ligand, 6-chloro-2,3,4,5-tetrahydro-3-methyl-1-(3-methylphenyl)-1H-3-benzazepine-7,8-diol (SKF83959), found no stimulation of calcium release, but it did find a broad range of cross-reactivity with other G protein-coupled receptors. In contrast, SKF83959 appeared to be an antagonist of calcium mobilization. Overexpression of G(qα) with the D(1) and D(2) dopamine receptors enhanced the dopamine-stimulated calcium response. However, this was also observed in cells expressing G(qα) with only the D1R. Inactivation of Gi or Gs with pertussis or cholera toxin, respectively, largely, but not entirely, reduced the calcium response in D(1)R and D(2)R cotransfected cells. Moreover, sequestration of G(βγ) subunits through overexpression of G protein receptor kinase 2 mutants either completely or largely eliminated dopamine-stimulated calcium mobilization. Our data suggest that the mechanism of D(1)R/D(2)R-mediated calcium signaling involves more than receptor-mediated G(q) protein activation, may largely involve downstream signaling pathways, and may not be completely heteromer-specific. In addition, SKF83959 may not exhibit selective activation of D(1)-D(2) heteromers, and its significant cross-reactivity to other receptors warrants careful interpretation of its use in vivo.


Figures

Fig. 1.
Fig. 1.
Agonist-induced calcium mobilization in DA receptor–transfected cells. HEK293T cells were transiently transfected with D1R, D2LR, D2SR, D1R + D2LR, or D1R + D2SR, as indicated and described in Materials and Methods. Twenty-four hours later, cells were plated in 384-well plates and assayed the following day for calcium mobilization after stimulation by DA (D1R + D2LR EC50 = 73.8 nM, D1R + D2SR, EC50 = 58.2 nM). Data are representative of three independent experiments done with the same assay conditions on different days. Data are expressed as percentage of control, normalized to the maximum signal seen via DA stimulation of D1R + D2LR transfected cells. Error bars indicate S.E.M. from multiple wells within the representative experiment.
Fig. 2.
Fig. 2.
Inhibition of D1R + D2LR–mediated calcium mobilization by either D1R- or D2R-selective antagonists. HEK293T cells were transfected with D1R + D2LR as described and 24 hours later were plated in 384-well plates. Cells were incubated with the indicated concentrations of the D1R-selective antagonist SCH23390 (A) or the D2R-selective antagonist sulpiride (B) and then stimulated with an ∼EC80 of DA (1 μM; SCH23390 IC50 = 8.0 nM, sulpiride, IC50 = 0.7 nM). Data are expressed as a percentage of the control (10 μM) DA response and are representative of two independent experiments performed with the same assay conditions on different days. Error bars indicate S.E.M. from multiple wells within the representative experiment.
Fig. 3.
Fig. 3.
Stimulation of D1R + D2LR–mediated calcium mobilization by either D1R- or D2R-selective agonists. HEK293T cells were transfected with D1 R+ D2LR as described, plated 24 hours later in 384-well plates, and assayed for calcium accumulation the following day. Cells were stimulated with one of the following agonists as indicated: DA, the D1R-selective agonist SKF83822, the D2R-selective agonist quinpirole, or both SKF83822 and quinpirole (D1R + D2LR EC50 = 610.8 nM) combined. Control cells expressing the D1R, D2SR, or D2LR individually did not show a significant calcium response to concurrent agonist administration. Data are expressed as a percentage of control maximum DA-stimulated response and are representative of two independent experiments performed with the same assay conditions on different days. Error bars indicate S.E.M. from multiple wells within the representative experiment.
Fig. 4.
Fig. 4.
Pharmacological characterization of SKF83959 on D1R + D2LR–mediated calcium mobilization. HEK293T cells were transfected with D1R + D2LR as described, plated 24 hours later in 384-well plates, and assayed for calcium accumulation the following day. (A) Cells were stimulated with one of the following conditions as indicated: DA, SKF83959, the D2R-selective agonist quinpirole, or both SKF83959 and quinpirole combined. (B) Cells were incubated with SKF83959 or the D1R-selective antagonist SCH23390, then stimulated with an ∼EC80 of DA (1 μM). Data are expressed as a percentage of control maximum DA-stimulated response and are representative of two or three independent experiments performed with the same assay conditions on different days. Error bars indicate S.E.M. from multiple wells within the representative experiment. (C) HEK293 cells stably transfected with D1R (Codex Biosolutions, Inc., Gaithersburg, MD) were grown and membranes harvested as described in Materials and Methods. Membranes were incubated with various concentrations of SKF83959 and 0.5 nM [3H]SCH23390 as indicated. Graph is representative of two independent experiments done on different days. Data are expressed as specific binding in units of fmol/mg. Ki value was calculated using the Cheng-Prushoff equation and a radioligand Kd value of 0.5 nM as determined via saturation binding isotherms (unpublished data). Average Ki for SKF83959 on D1R was 2.6 nM ± 0.7.
Fig. 5.
Fig. 5.
Influence of Gqα protein overexpression on D1R + D2LR–mediated calcium mobilization. (A) HEK293T cells were transfected with D1R + D2LR with and without Gqα or with Gqα alone (D1R + D2R EC50 = 168.3 nM, ECmax = 100%; D1R + D2R + Gq EC50 = 16.8 nM, ECmax = 300.1%). (B) HEK293T cells were transfected with D1R + D2LR, D1R, or D2R with and without Gqα (D1R + Gq EC50 = 10.3 nM, ECmax = 152.2%). Twenty-four hours later, cells were plated in 384-well plates and assayed the following day for calcium mobilization after stimulation by the indicated concentrations of DA. Data are expressed as a percentage of control maximum DA stimulation for D1R + D2LR alone and are representative of two or three independent experiments performed with the same assay conditions on different days. Error bars indicate S.E.M. from multiple wells within the representative experiment.
Fig. 6.
Fig. 6.
SKF83959 stimulates D1R-dependent calcium mobilization in the presence of Gqα. HEK293T cells were transfected with D1R + D2LR, Gqα or with Gqα alone as described, plated 24 hours later in 384-well plates, and assayed for calcium accumulation the following day. (A) Cells were stimulated with SKF83959. The line at 100% denotes the maximal DA response of D1R + D2LR cells. (B) Cells were incubated with the D1R-selective antagonist SCH23390 (1 μM) or the D2R-selective antagonist sulpiride (1 μM) and then stimulated with an ∼EC80 of SKF83959 (100 nM). Error bars indicate S.E.M. from multiple wells within the representative experiment, which was replicated twice with similar results. DMSO, dimethylsulfoxide.
Fig. 7.
Fig. 7.
G protein dependency of D1R + D2LR–mediated calcium mobilization. HEK293T cells were transfected with D1R + D2LR. Cells were incubated overnight in 1 μg/ml PTX or 1 μg/ml CTX; 48 hours post transfection, cells were assayed for calcium mobilization by stimulation with the indicated concentrations of DA (CTX ECmax = 14%, inhibition = 86% control, PTX ECmax = 24%, inhibition = 76% control). Data are expressed as a percentage of control maximum DA stimulation seen in untreated D1R + D2LR cells and are representative of two or three independent experiments performed with the same assay conditions on different days. Error bars indicate S.E.M. from multiple wells within the representative experiment.
Fig. 8.
Fig. 8.
Dopamine does not elicit a calcium response in cells co-expressing the D1R and D4R. HEK293T cells were transiently transfected with D1R + D2LR or D1R + D4R, as indicated and described in Materials and Methods. Twenty-four hours later, cells were plated in 384-well plates and assayed for calcium mobilization through stimulation by the indicated concentrations of DA. Data are expressed as a percentage of control maximum DA stimulation seen in cells transfected with D1R + D2LR only (EC50 = 162.0 nM) and are representative of two or three independent experiments done with the same assay conditions on different days. Expression of the D4R was confirmed using radioligand binding assays as described in Materials and Methods and was similar to that of the D2R. Error bars indicate S.E.M. from multiple wells within the representative experiment.
Fig. 9.
Fig. 9.
GRK2 influence on DA-mediated D1R + D2LR calcium mobilization. HEK293T cells were transiently transfected with D1R + D2LR and either empty pcDNA vector the GRK2 catalytically inactive mutant GRK2 K220R (A) (D1R + D2R EC50 = 269.1 nM) or the GRK2 C-terminal 495–689 fragment (B; GRK2 c-term; D1R + D2R EC50 = 90.4 nM, ECmax = 100% control; D1R+D2R + pcDNA EC50 = 188.5 nM, ECmax = 106%; D1R + D2R +GRK2 c-term EC50 = 288.1 nM, ECmax = 30% control, 70% inhibition), as indicated and described in Materials and Methods. Twenty-four hours later, cells were plated in 384-well plates and assayed the following day for calcium mobilization after stimulation by the indicated concentrations of DA. Data are expressed as a percentage of control maximum DA stimulation seen in cells transfected with D1R + D2LR only and are representative of two or three independent experiments done with the same assay conditions on different days. Error bars indicate S.E.M. from multiple wells within the representative experiment.
Fig. 10.
Fig. 10.
Various mechanisms of PLCβ activation that may occur when the D1R and D2R are coexpressed and coactivated.

References

    1. Aizman O, Brismar H, Uhlén P, Zettergren E, Levey AI, Forssberg H, Greengard P, Aperia A. (2000) Anatomical and physiological evidence for D1 and D2 dopamine receptor colocalization in neostriatal neurons. Nat Neurosci 3:226–230 - PubMed
    1. Allen JA, Halverson-Tamboli RA, Rasenick MM. (2007) Lipid raft microdomains and neurotransmitter signalling. Nat Rev Neurosci 8:128–140 - PubMed
    1. Andringa G, Stoof JC, Cools AR. (1999) Sub-chronic administration of the dopamine D(1) antagonist SKF 83959 in bilaterally MPTP-treated rhesus monkeys: stable therapeutic effects and wearing-off dyskinesia. Psychopharmacology (Berl) 146:328–334 - PubMed
    1. Ariano MA, Larson ER, Noblett KL, Sibley DR, Levine MS. (1997) Coexpression of striatal dopamine receptor subtypes and excitatory amino acid subunits. Synapse 26:400–414 - PubMed
    1. Beaulieu J-M, Gainetdinov RR. (2011) The physiology, signaling, and pharmacology of dopamine receptors. Pharmacol Rev 63:182–217 - PubMed

Publication types

MeSH terms