

Failure of fibrotic liver regeneration in mice is linked to a severe fibrogenic response driven by hepatic progenitor cell activation
- PMID: 23680654
- PMCID: PMC3702745
- DOI: 10.1016/j.ajpath.2013.03.018
Failure of fibrotic liver regeneration in mice is linked to a severe fibrogenic response driven by hepatic progenitor cell activation
Abstract
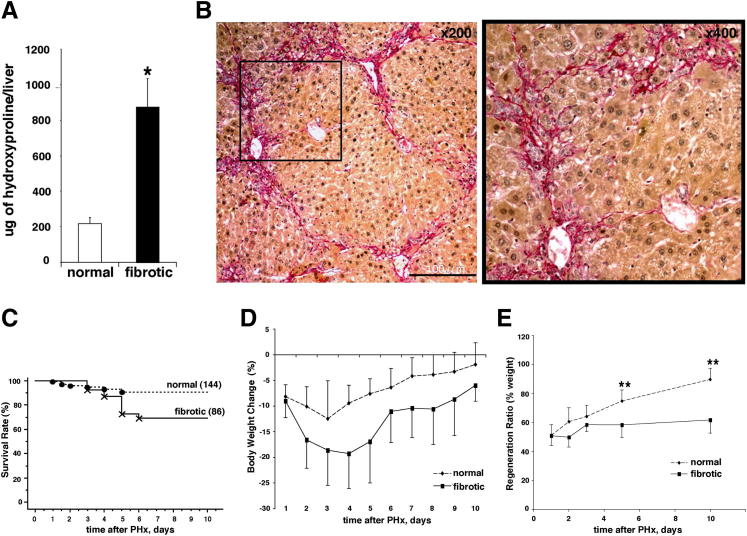
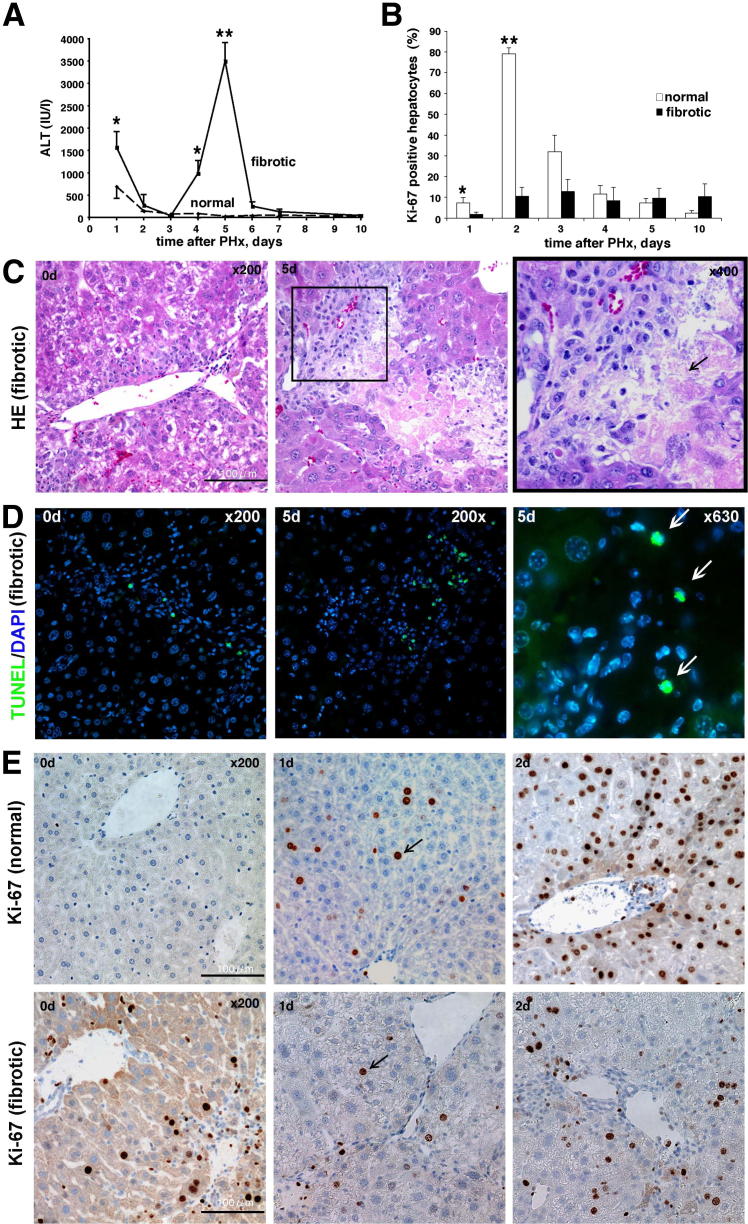
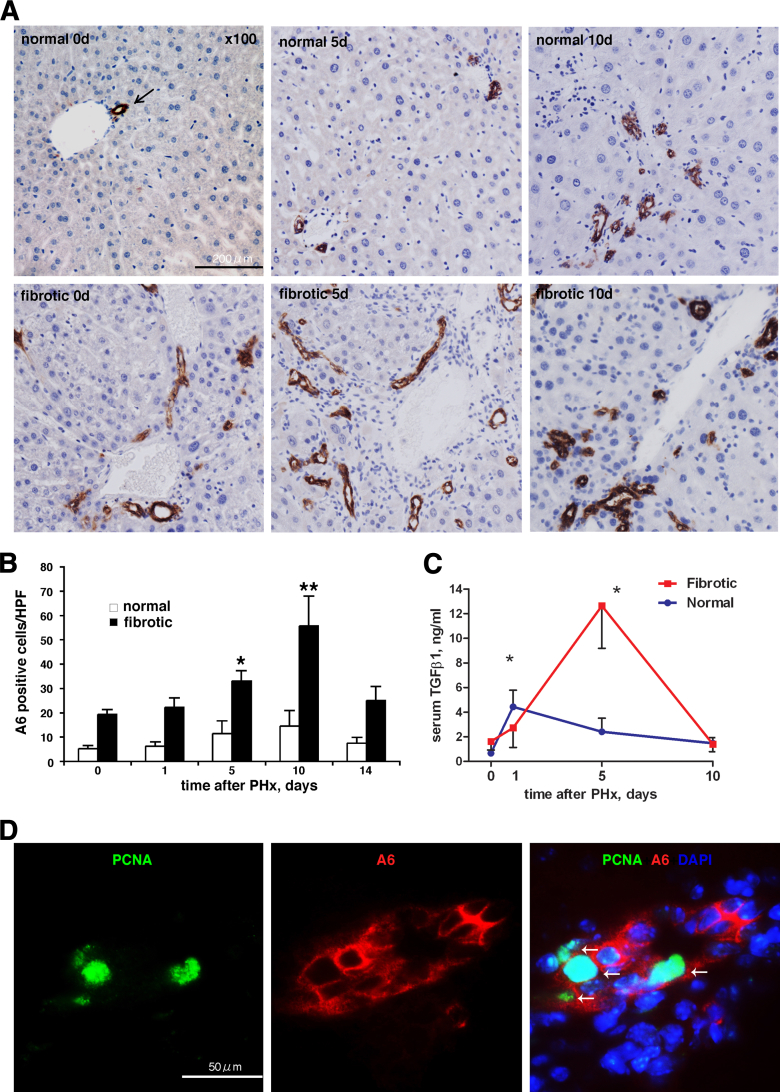
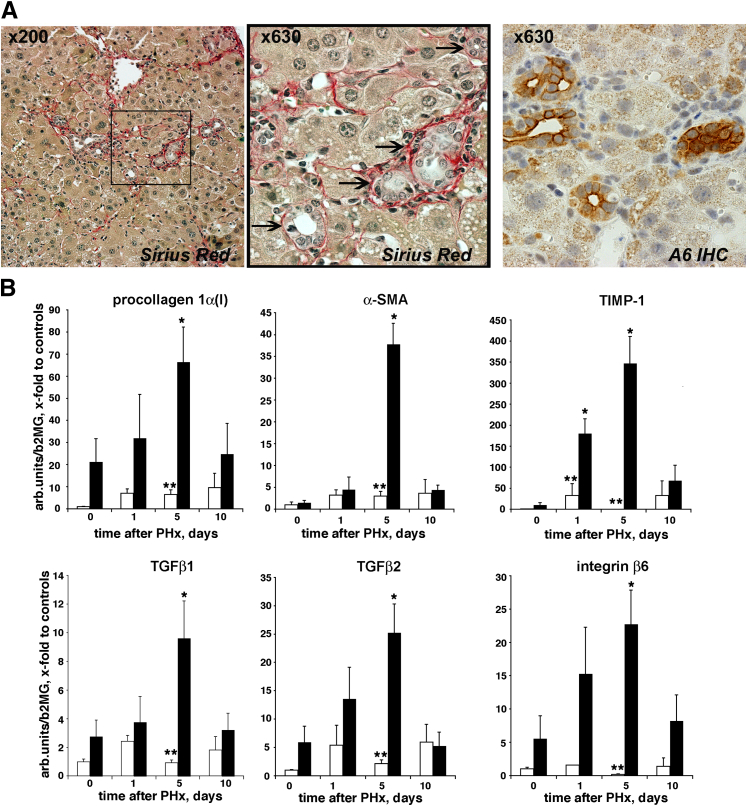
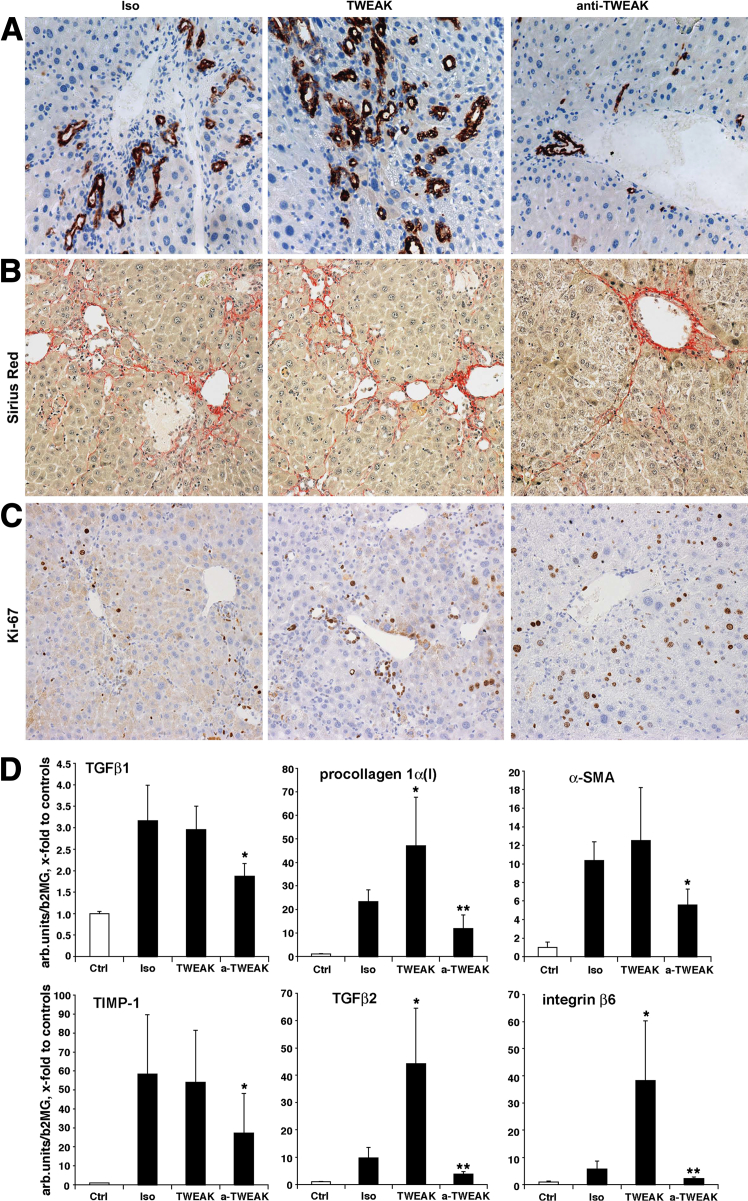
Failure of fibrotic liver to regenerate after resection limits therapeutic options and increases demand for liver transplantation, representing a significant clinical problem. The mechanism underlying regenerative failure in fibrosis is poorly understood. Seventy percent partial hepatectomy (PHx) was performed in C57Bl/6 mice with or without carbon tetrachloride (CCl4)-induced liver fibrosis. Liver function and regeneration was monitored at 1 to 14 days thereafter by assessing liver mass, alanine aminotransferase (ALT), mRNA expression, and histology. Progenitor (oval) cell mitogen tumor necrosis factor-like weak inducer of apoptosis (TWEAK) and TWEAK-neutralizing antibody were used to manipulate progenitor cell proliferation in vivo. In fibrotic liver, hepatocytes failed to replicate efficiently after PHx. Fibrotic livers showed late (day 5) peak of serum ALT (3542 ± 355 IU/L compared to 93 ± 65 IU/L in nonfibrotic livers), which coincided with progenitor cell expansion, increase in profibrogenic gene expression and de novo collagen deposition. In fibrotic mice, inhibition of progenitor activation using TWEAK-neutralizing antibody after PHx resulted in strongly down-regulated profibrogenic mRNA, reduced serum ALT levels and improved regeneration. Failure of hepatocyte-mediated regeneration in fibrotic liver triggers activation of the progenitor (oval) cell compartment and a severe fibrogenic response. Inhibition of progenitor cell proliferation using anti-TWEAK antibody prevents fibrogenic response and augments fibrotic liver regeneration. Targeting the fibrogenic progenitor response represents a promising strategy to improve hepatectomy outcomes in patients with liver fibrosis.
Copyright © 2013 American Society for Investigative Pathology. Published by Elsevier Inc. All rights reserved.
Figures
Comment in
-
Role of TWEAK in coregulating liver progenitor cell and fibrogenic responses.Hepatology. 2014 Mar;59(3):1198-201. doi: 10.1002/hep.26701. Epub 2014 Jan 27. Hepatology. 2014. PMID: 24038142 No abstract available.
Similar articles
-
Hepatocyte growth factor gene therapy accelerates regeneration in cirrhotic mouse livers after hepatectomy.Gut. 2003 May;52(5):694-700. doi: 10.1136/gut.52.5.694. Gut. 2003. PMID: 12692055 Free PMC article.
-
Partial hepatectomy-induced regeneration accelerates reversion of liver fibrosis involving participation of hepatic stellate cells.Exp Biol Med (Maywood). 2008 Jul;233(7):827-39. doi: 10.3181/0709-RM-247. Epub 2008 Apr 29. Exp Biol Med (Maywood). 2008. PMID: 18445764
-
Decorin accelerates the liver regeneration after partial hepatectomy in fibrotic mice.Chin Med J (Engl). 2014;127(14):2679-85. Chin Med J (Engl). 2014. PMID: 25043089
-
Links between hepatic fibrosis, ductular reaction, and progenitor cell expansion.Gastroenterology. 2014 Feb;146(2):349-56. doi: 10.1053/j.gastro.2013.11.034. Epub 2013 Dec 4. Gastroenterology. 2014. PMID: 24315991 Review.
-
The role of Hedgehog signaling in fibrogenic liver repair.Int J Biochem Cell Biol. 2011 Feb;43(2):238-44. doi: 10.1016/j.biocel.2010.10.015. Epub 2010 Nov 5. Int J Biochem Cell Biol. 2011. PMID: 21056686 Free PMC article. Review.
Cited by
-
Targeting fibroblast growth factor (FGF)-inducible 14 (Fn14) for tumor therapy.Front Pharmacol. 2022 Oct 21;13:935086. doi: 10.3389/fphar.2022.935086. eCollection 2022. Front Pharmacol. 2022. PMID: 36339601 Free PMC article. Review.
-
Role of the TWEAK-Fn14-cIAP1-NF-κB Signaling Axis in the Regulation of Myogenesis and Muscle Homeostasis.Front Immunol. 2014 Feb 5;5:34. doi: 10.3389/fimmu.2014.00034. eCollection 2014. Front Immunol. 2014. PMID: 24550918 Free PMC article. Review.
-
Dectin-1 Regulates Hepatic Fibrosis and Hepatocarcinogenesis by Suppressing TLR4 Signaling Pathways.Cell Rep. 2015 Dec 1;13(9):1909-1921. doi: 10.1016/j.celrep.2015.10.058. Epub 2015 Nov 19. Cell Rep. 2015. PMID: 26655905 Free PMC article.
-
β-Actin: Not a Suitable Internal Control of Hepatic Fibrosis Caused by Schistosoma japonicum.Front Microbiol. 2019 Jan 31;10:66. doi: 10.3389/fmicb.2019.00066. eCollection 2019. Front Microbiol. 2019. PMID: 30766520 Free PMC article.
-
A novel non-bile acid FXR agonist EDP-305 potently suppresses liver injury and fibrosis without worsening of ductular reaction.Liver Int. 2020 Jul;40(7):1655-1669. doi: 10.1111/liv.14490. Epub 2020 May 6. Liver Int. 2020. PMID: 32329946 Free PMC article.
References
-
- Michalopoulos G.K., DeFrances M.C. Liver regeneration. Science. 1997;276:60–66. - PubMed
-
- Fausto N., Campbell J.S. The role of hepatocytes and oval cells in liver regeneration and repopulation. Mech Dev. 2003;120:117–130. - PubMed
-
- Roskams T.A., Theise N.D., Balabaud C., Bhagat G., Bhathal P.S., Bioulac-Sage P., Brunt E.M., Crawford J.M., Crosby H.A., Desmet V., Finegold M.J., Geller S.A., Gouw A.S., Hytiroglou P., Knisely A.S., Kojiro M., Lefkowitch J.H., Nakanuma Y., Olynyk J.K., Park Y.N., Portmann B., Saxena R., Scheuer P.J., Strain A.J., Thung S.N., Wanless I.R., West A.B. Nomenclature of the finer branches of the biliary tree: canals, ductules, and ductular reactions in human livers. Hepatology. 2004;39:1739–1745. - PubMed
-
- Saxena R., Theise N.D., Crawford J.M. Microanatomy of the human liver-exploring the hidden interfaces. Hepatology. 1999;30:1339–1346. - PubMed
-
- Sell S. Heterogeneity and plasticity of hepatocyte lineage cells. Hepatology. 2001;33:738–750. - PubMed
Publication types
MeSH terms
Substances
Grants and funding
LinkOut - more resources
Full Text Sources
Other Literature Sources
Medical
