. 2013 May 16;4(5):e636.
doi: 10.1038/cddis.2013.160.

Neuropeptide Y receptors activation protects rat retinal neural cells against necrotic and apoptotic cell death induced by glutamate

Affiliations

Neuropeptide Y receptors activation protects rat retinal neural cells against necrotic and apoptotic cell death induced by glutamate

A Santos-Carvalho et al. Cell Death Dis. .

Abstract

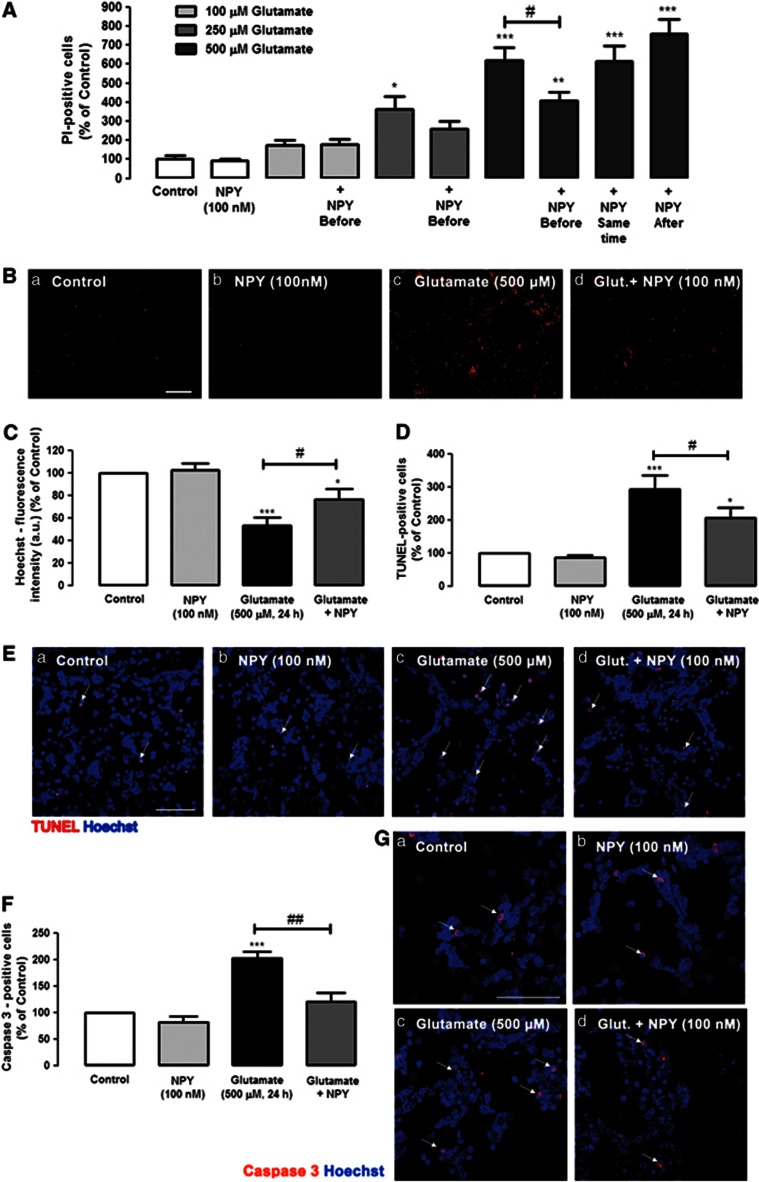
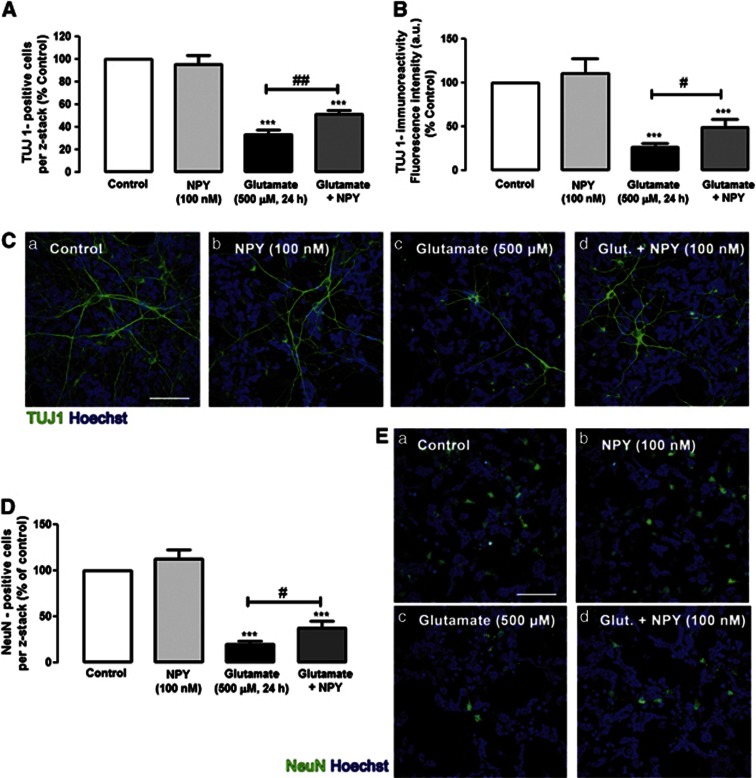
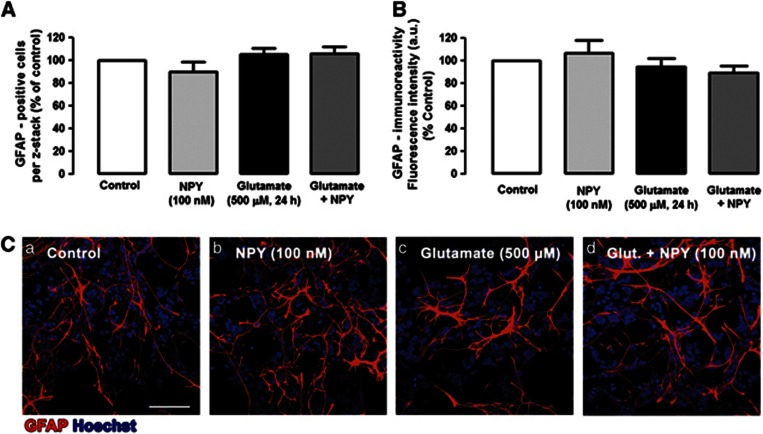
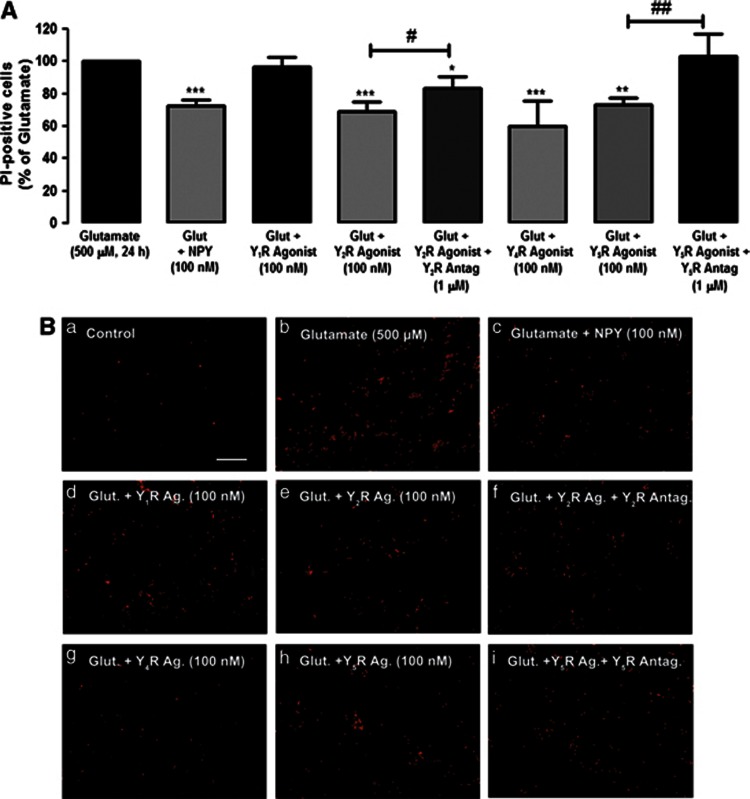
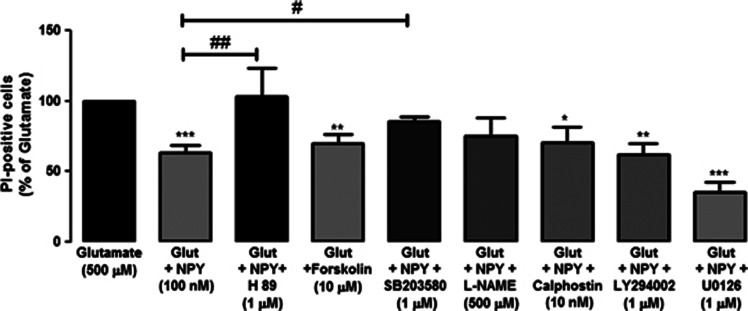
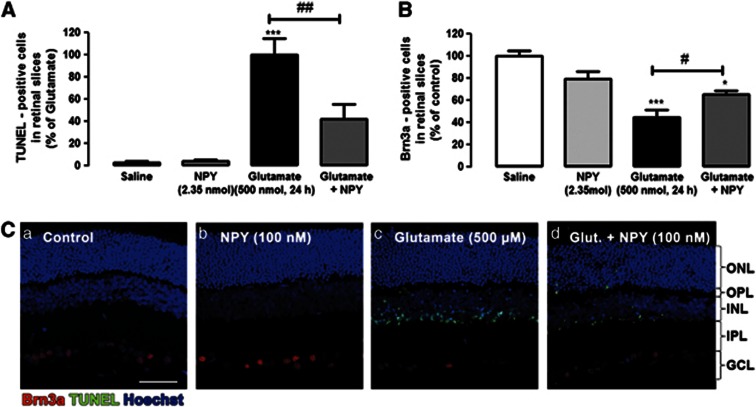
It has been claimed that glutamate excitotoxicity might have a role in the pathogenesis of several retinal degenerative diseases, including glaucoma and diabetic retinopathy. Neuropeptide Y (NPY) has neuroprotective properties against excitotoxicity in the hippocampus, through the activation of Y1, Y2 and/or Y5 receptors. The principal objective of this study is to investigate the potential protective role of NPY against glutamate-induced toxicity in rat retinal cells (in vitro and in an animal model), unraveling the NPY receptors and intracellular mechanisms involved. Rat retinal neural cell cultures were prepared from newborn Wistar rats (P3-P5) and exposed to glutamate (500 μM) for 24 h. Necrotic cell death was evaluated by propidium iodide (PI) assay and apoptotic cell death using TUNEL and caspase-3 assays. The cell types present in culture were identified by immunocytochemistry. The involvement of NPY receptors was assessed using selective agonists and antagonists. Pre-treatment of cells with NPY (100 nM) inhibited both necrotic cell death (PI-positive cells) and apoptotic cell death (TUNEL-positive cells and caspase 3-positive cells) triggered by glutamate, with the neurons being the cells most strongly affected. The activation of NPY Y2, Y4 and Y5 receptors inhibited necrotic cell death, while apoptotic cell death was only prevented by the activation of NPY Y5 receptor. Moreover, NPY neuroprotective effect was mediated by the activation of PKA and p38K. In the animal model, NPY (2.35 nmol) was intravitreally injected 2 h before glutamate (500 nmol) injection into the vitreous. The protective role of NPY was assessed 24 h after glutamate (or saline) injection by TUNEL assay and Brn3a (marker of ganglion cells) immunohistochemistry. NPY inhibited the increase in the number of TUNEL-positive cells and the decrease in the number of Brn3a-positive cells induced by glutamate. In conclusion, NPY and NPY receptors can be considered potential targets to treat retinal degenerative diseases, such as glaucoma and diabetic retinopathy.


Figures

Figure 1
Figure 1
NPY protects against necrotic and apoptotic retinal cell death induced by glutamate. (A and B) Necrotic cells were assessed by PI incorporation assay. (C) Cell nuclei were stained by Hoechst 33342. Apoptotic cells were assessed by (D and E) TUNEL assay and (F and G) cleaved caspase 3- immunocytochemistry. (A) Quantification of PI-positive cells (percentage of control). Retinal cells were exposed to different concentrations of glutamate (100, 250 and 500 μM) for 24 h and treated with NPY (100 nM) at three different time points: 1 h before, simultaneously, and 30 min after glutamate, as indicated below bars. The results represent the mean±S.E.M of n=4–11 independent experiments; ***P<0.001, **P<0.01, *P<0.05, compared with control; #P<0.05, compared with glutamate (500 μM); one-way analysis of variance (ANOVA) followed by Bonferroni's post-hoc test. (B) Representative images of (a) control and cultures treated with (b) NPY, (c) glutamate or (d) glutamate+NPY (1 h before), showing PI-positive cells (red spots), Bar=100 μm. (C) Quantification of fluorescence intensity (arbitrary units) of cells stained with Hoechst 33342 (nucleus marker), compared with control (no drug). These results represent the mean±S.E.M. of n=21–27 independent experiments; ***P<0.001, *P<0.05, compared with control; #P<0.05, compared with glutamate; one-way ANOVA followed by Bonferroni's post-hoc test. (D) Quantification of TUNEL-positive cells (percentage of control). Cultured retinal cells were exposed to glutamate and treated with NPY (1 h before glutamate exposure), as indicated below bars. Data represent the mean±S.E.M. of n=5–6 independent experiments; ***P<0.001, *P<0.05, compared with control; #P<0.05, compared with glutamate; one-way ANOVA followed by Bonferroni's post-hoc test. (E) Representative images of (a) control and cultures treated with (b) NPY, (c) glutamate or (d) glutamate+NPY (1 h before), showing TUNEL-positive cells (purple spots, indicated by white arrows) and cell nuclei stained with Hoechst 33342 (blue); Bar=50 μm. (F) Quantification of cleaved caspase-3 positive cells (red) per field compared with control conditions (100% no drug, Ga). Rat retinal cells were exposed to glutamate and treated with NPY (1 h before glutamate exposure), as indicated below bars. The results represent the mean±S.E.M. of n=5–6 independent experiments; ***P<0.001, *P<0.05, compared with control; #P<0.05, compared with glutamate; one-way ANOVA followed by Bonferroni's post-hoc test. (G) Representative images of (a) control and cultures treated with (b) NPY, (c) glutamate or (d) glutamate+NPY (1 h before), showing cleaved caspase 3-positive cells (purple spots). Cell nuclei were stained with Hoechst 33342 (blue). NPY per se had no effect on the number of PI-, Hoechst 33342-, TUNEL-, or cleaved caspase 3-positive cells compared with control. Bar=50 μm
Figure 2
Figure 2
NPY protects neuronal cell death induced by glutamate in rat retinal neural cell cultures. Neurons were identified with (C) anti-TUJ1 (green) or (E) anti-NeuN (green) antibodies, respectively. (A) Quantification of TUJ1-positive cells per z-stack. The results were normalized and are presented as percentage of control condition. The results represent the mean±S.E.M. of n=5–7 independent experiments; ***P<0.001, compared with control; ##P<0.01, compared with glutamate; one-way analysis of variance (ANOVA) followed by Bonferroni's post-hoc test. (B) Quantification of TUJ 1-immunoreactivity by fluorescence intensity (arbitrary units), compared with control conditions (100% no drug, Ca). The results represent the mean±S.E.M. of n=4–8 independent experiments ***P<0.001, compared with control; #P<0.05, compared with glutamate; one-way ANOVA followed by Bonferroni's post-hoc test. (C) Representative images of (a) control cultures and cultures treated with (b) NPY, (c) glutamate or (d) glutamate+NPY, showing TUJ1-positive cells (green). Cell nuclei were identified by Hoechst 33342 staining (blue). (D) Quantification of NeuN-positive cells per z-stack. The results were normalized and are presented as percentage of control condition. The results represent the mean±S.E.M. of n=3–5 independent experiments; ***P<0.001, compared with control; #P<0.05, compared with glutamate; one-way ANOVA followed by Bonferroni's post-hoc test. (E) Representative images of (a) control cultures and cultures treated with (b) NPY, (c) glutamate or (d) glutamate+NPY, showing NeuN-positive cells (green). Cell nuclei were stained with Hoechst 33342 (blue). NPY per se did not affect the number of TUJ1- or NeuN-positive cells or the TUJ1-immunoreactivity compared with control. Bar=50 μm
Figure 3
Figure 3
NPY has no effect in glial cells. Microglial cells were identified with (C) anti-GFAP (red) antibody. (A) Quantification of GFAP-positive cells per z-stack. (B) Quantification of GFAP-immunoreactivity by fluorescence intensity (arbitrary units), compared with control conditions (100% no drug, Ca). The results were normalized and are presented as percentage of control condition. (C) Representative images of (a) control and cultures treated with (b) NPY, (c) glutamate or (d) glutamate+NPY, showing GFAP-positive cells (red). Cell nuclei were stained with Hoechst 33342 (blue). NPY per se did not affect the number of GFAP-positive cells or the GFAP-immunoreactivity compared with control. Bar=50 μm
Figure 4
Figure 4
Glutamate and NPY increase the proliferation and activation of retinal microglial cells. Microglial cells were identified by immunocytochemistry using (C) anti-CD11b (green) and (F) anti-CD68/ED1 (red) antibodies. (A) Quantification of CD11b-positive cells (green) per field, compared with control conditions (no drug, Ca). (B) Quantification of fluorescence intensity (arbitrary units) of CD11b-immunoreactivity, compared with control (100% no drug, Ca). These results (A and B) represent the mean±S.E.M. of n=8 independent experiments, with **P<0.01, *P<0.05, compared with control; one-way analysis of variance (ANOVA) followed by Bonferroni's post-hoc test. (C) Representative images of (a) control and cultures treated with (b) NPY, (c) glutamate or (d) glutamate+NPY, showing CD11b- positive cells (green). Cell nuclei were stained by Hoechst 33342 (blue). Bar=50 μm. (D) Quantification of CD68/ED1-positive cells per field, compared with control (100% no drug, Da). (E) Quantification of fluorescence intensity (arbitrary units) of CD68/ED1-immunoreactivity, compared with control (100% no drug, Da). These results (D and E) represent the mean±S.E.M. of n=5 independent experiments; ***P<0.001, **P<0.01, *P<0.05, compared with control; one-way ANOVA followed by Bonferroni's post-hoc test. (F) Representative images of (a) control, and cultures treated with (b) NPY, (c) glutamate or (d) glutamate+NPY, showing CD 68/ED1-positive cells. Cell nuclei were stained by Hoechst 33342 (blue). Bar=50 μm
Figure 5
Figure 5
The activation of NPY Y2, Y4 and Y5 receptors inhibits the necrotic cell death induced by glutamate. Necrotic cells were evaluated by PI incorporation assay. Cells were exposed to glutamate, and treated with NPY, or NPY receptor agonists and antagonists, indicated below bars. (A) Quantification of PI-positive cells (percentage of glutamate condition) per field in retinal cell cultures treated with NPY Y1 receptor agonist ([Leu,31Pro34]NPY;100 nM); NPY Y2 receptor agonist (NPY13–36; 100 nM) and antagonist (BIIE 0246; 1 μM); NPY Y4 agonist receptor (r-PP, 100 nM); NPY Y5 receptor agonist ((Gly,1Ser,3,22Gln,4,34Thr,6Arg,19Tyr,21Ala,23,31Aib32)PP) and antagonist (L-152,804; 1 μM). (B) Representative images of (a) control and cultures treated with (b) glutamate, (c) glutamate+NPY, (d) glutamate+Y1R agonist, (e) glutamate+Y2R agonist, (f) glutamate+Y2R agonist+Y2R antagonist, (g) glutamate+Y4R agonist, (h) glutamate+Y5R agonist and (i) glutamate+Y5R agonist+Y5R, showing PI-positive cells (red spots). Bar=100 μm. Values are expressed as the percentage of PI-positive cells per field compared with the glutamate condition. The results represent mean±S.E.M. of n=4–11 independent experiments; ***P<0.001, **P<0.01, compared with glutamate; ###P<0.001, ##P<0.01, compared with glutamate+NPY receptor agonist; one-way analysis of variance followed by Bonferroni's post-hoc test
Figure 6
Figure 6
The activation of NPY Y5 receptor inhibits the apoptotic cell death induced by glutamate. Apoptotic cells were assessed by TUNEL assay. Cells were exposed to glutamate and treated with NPY, or NPY receptor agonists and antagonists, as indicated below bars. (A) Quantification of TUNEL-positive cells per field compared with glutamate condition (100%) in retinal cell cultures treated with NPY Y1 receptor agonist ([Leu,Pro]NPY, 100 nM); NPY Y2 receptor agonist (NPY13–36; 100 nM); NPY Y4 agonist receptor (r-PP, 100 nM); NPY Y5 receptor agonist ((Gly,Ser,, Gln,, Thr,Arg,Tyr,Ala,, Aib)PP, 100 nM) and antagonist (L-152,804; 1 μM). (B) Representative images of (a) control and cultures treated with (b) glutamate, (c) glutamate+NPY, (d) glutamate+Y1R agonist, (e) glutamate+Y2R agonist, (f) glutamate+Y4R agonist, (g) glutamate+Y5R agonist and (h) glutamate+Y5R agonist+Y5R antagonist, showing TUNEL-positive cells (purple spots – some examples are indicated by white arrows). Bar=50 μm. Values are expressed as the percentage of TUNEL-positive cells per field compared with the glutamate condition. The results represent mean±S.E.M. of n=5–6 independent experiments, with *P<0.05, compared with glutamate; ##P<0.01, compared with glutamate +Y5R agonist; one-way analysis of variance followed by Bonferroni's post-hoc test
Figure 7
Figure 7
PKA and protein 38 kinase (p38K) mediate the neuroprotective effect of NPY against retinal neuronal cell death triggered by glutamate. The involvement of different intracellular pathways in the neuroprotective effect of NPY against glutamate-induced excitotoxicity was assessed by PI uptake (PI-positive cells), using different inhibitors of proteins involved on those pathways. Retinal cell cultures were exposed to NPY (100 nM), glutamate (500 μM) and the inhibitors indicated below bars. Quantification of PI-positive cells (compared with glutamate condition) in retinal cells treated with H89 (1 μM; PKA inhibitor), forskolin (10 μM; PKA activator), SD203580 (1 μM; p38K inhibitor), L-NAME (500 μM; NOS inhibitor), calphostin C (10 nM; PKC inhibitor), LY294002 (1 μM; PI3K inhibitor) and U0126 (1 μM; MEK1/2 inhibitor). Values are expressed as the percentage of PI-positive cells (per field), compared with the glutamate condition. The results represent the mean±S.E.M. of n=7–9 independent experiments, with ***P<0.001, **P<0.01, *P<0.05, compared with glutamate; ##P<0.01, #P<0.05, compared with glutamate+NPY; one-way analysis of variance followed by Bonferroni's post-hoc test
Figure 8
Figure 8
NPY protects against apoptotic cell death in the rat retina induced by glutamate. Cells undergoing apoptosis were identified by TUNEL assay, and ganglion cells were identified by immunohistochemistry against Brn3a (ganglion cell marker). (A) Quantification of TUNEL-positive cells in rat retinal slices (presented as percentage of glutamate condition). Retinas were exposed to glutamate (500 nmol; intravitreal injection) and treated (or not) with NPY (2.35 nmol, 2 h before intravitreal injection of glutamate), as indicated below bars. Data represent the mean±S.E.M. of n=3–5 independent experiments (animals); ***P<0.001 compared with control; #P<0.05, compared with glutamate; one-way analysis of variance (ANOVA) followed by Bonferroni's post-hoc test. (B) Quantification of Brn3a-positive cells in rat retinal slices (presented as percentage of control). Retinas were exposed to glutamate (500 nmol; intravitreal injection) and treated (or not) with NPY (2.35 nmol, 2 h before glutamate exposure), as indicated below bars. Data represent the mean±S.E.M. of n=3–5 independent experiments; ***P<0.001, *P<0.05, compared with control; #P<0.05, compared with glutamate; one-way ANOVA followed by Bonferroni's post-hoc test. (C) Representative images of retinal slices obtained from eyes exposed to different conditions (intravitreal injection): (a) saline (0.9% NaCl), treated with (b) NPY, (c) glutamate (500 nmol) or (d) glutamate+NPY (2.35 nmol, 2 h before glutamate), showing TUNEL-positive cells (green), Brn3a-positive cells (red), and cell nuclei stained with Hoechst 33342 (blue). NPY per se had no effect on the number of TUNEL- or Brn3a-positive cells compared with control. IPL, inner plexiform layer; OPL, outer plexiform layer. Bar=50 μm

Similar articles

Cited by

References

    1. Dumont Y, Martel JC, Fournier A, St-Pierre S, Quirion R. Neuropeptide Y and neuropeptide Y receptor subtypes in brain and peripheral tissues. Prog Neurobiol. 1992;38:125–167. - PubMed
    1. Silva AP, Xapelli S, Grouzmann E, Cavadas C. The putative neuroprotective role of neuropeptide Y in the central nervous system. Curr Drug Targets CNS Neurol Disord. 2005;4:331–347. - PubMed
    1. Tatemoto K, Carlquist M, Mutt V. Neuropeptide Y—a novel brain peptide with structural similarities to peptide YY and pancreatic polypeptide. Nature. 1982;296:659–660. - PubMed
    1. Michel MC. Receptors for neuropeptide Y: multiple subtypes and multiple second messengers. Trends Pharmacol Sci. 1991;12:389–394. - PubMed
    1. Silva AP, Cavadas C, Grouzmann E. Neuropeptide Y and its receptors as potential therapeutic drug targets. Clin Chim Acta. 2002;326:3–25. - PubMed

Publication types

MeSH terms

Substances