Brain microvessel cross-presentation is a hallmark of experimental cerebral malaria
- PMID: 23681698
- PMCID: PMC3721469
- DOI: 10.1002/emmm.201202273
Brain microvessel cross-presentation is a hallmark of experimental cerebral malaria
Abstract
Cerebral malaria is a devastating complication of Plasmodium falciparum infection. Its pathogenesis is complex, involving both parasite- and immune-mediated events. CD8(+) T cells play an effector role in murine experimental cerebral malaria (ECM) induced by Plasmodium berghei ANKA (PbA) infection. We have identified a highly immunogenic CD8 epitope in glideosome-associated protein 50 that is conserved across rodent malaria species. Epitope-specific CD8(+) T cells are induced during PbA infection, migrating to the brain just before neurological signs manifest. They are functional, cytotoxic and can damage the blood-brain barrier in vivo. Such CD8(+) T cells are also found in the brain during infection with parasite strains/species that do not induce neuropathology. We demonstrate here that PbA infection causes brain microvessels to cross-present parasite antigen, while non-ECM-causing parasites do not. Further, treatment with fast-acting anti-malarial drugs before the onset of ECM reduces parasite load and thus antigen presentation in the brain, preventing ECM death. Thus our data suggest that combined therapies targeting both the parasite and host antigen-presenting cells may improve the outcome of CM patients.
Keywords: T cells; brain; cross-presentation; malaria; pathology.
© 2013 The Authors. Published by John Wiley and Sons, Ltd on behalf of EMBO.
Figures


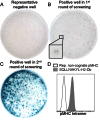
A–C. Well images of X-Gal-stained LR-BSL8.4a reporter cells incubated overnight with a library of EL4 cells transduced with P. berghei cDNA fragments. (A) A representative negative well. (B) The positive well in the first round of screening, containing about 250 library clones. An inset showing two blue cells at the original resolution is included. (C) A positive well in the second round of screening, containing a single library clone that was found to contain a fragment of PbGAP50.
D. Predicted MHC epitopes in the fragment were used to generate peptide-MHC tetramers for staining LR-BSL8.4a cells. Open histogram: representative non-cognate peptide-MHC tetramer. Filled histogram: SQLLNAKYL-H-2Db tetramer.

A–D. Representative dot plots of live cells, showing the gating of CD8+ T cells (CD8a+ CD16/32−) for tetramer analysis. (A) Naïve spleen. (B) Day 7 p.i. spleen. (C) Naïve brain. (D) Day 7 p.i. brain.
E–G. Analysis of tetramer-labelled cells amongst CD8+ T cells in the spleen (E), blood (F) and brain (G). Bars represent medians. *p < 0.05, **p < 0.01, Kruskal–Wallis test with Dunn's post-test. Results are representative of three experiments.

A,B. Combined tetramer and intracellular cytokine staining were performed on splenocytes and brain-sequestered leukocytes from PbA-infected mice 7 days p.i. Cells were incubated with Brefeldin A for 2 h without restimulation. (A) Representative IFN-γ and GrB profiles of live CD8+ T cells (CD8a+ CD16/32−). (B) The indicated IFN-γ+ GrB+ gate was used to analyze tetramer-labelled CD8+ T cells. Bars represent medians.
C. Equal numbers of CFSEhi unpulsed naïve splenocytes and CFSElo SQLLNAKYL-pulsed splenocytes were transferred into naïve or PbA-infected mice 6 days p.i. The mice were sacrificed 20 h later to analyze the CFSE-labelled cells in the spleens. The infected mouse is representative of n = 4, all with 96–97% specific lysis.

A,B. SQLLNAKYL-H-2Db tetramer staining was performed on splenocytes and brain-sequestered leukocytes of naïve, Py17X-infected and PbNK65-infected mice 7 days p.i.
A. Representative dot plots of live CD8+ T cells (CD8a+ CD16/32−).
B,C. Numbers of tetramer-labelled CD8+ T cells in the spleen (B) and brain (C). Bars represent medians. **p < 0.01, Kruskal–Wallis test with Dunn's post-test.
D. Equal numbers of CFSEhi unpulsed naïve splenocytes and CFSElo SQLLNAKYL-pulsed splenocytes were transferred into naïve, Py17X-infected or PbNK65-infected mice 6 days p.i. The mice were sacrificed 20 h later to analyze the CFSE-labelled cells in the spleens. Each infected mouse is representative of n = 4 (97–98% specific lysis for Py17X, 94–96% specific lysis for PbNK65).

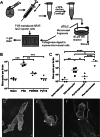
A. Schematic of brain microvessel cross-presentation assay. Mouse brains were minced, homogenized through a needle and centrifuged with an equal volume of 30% dextran. The pellets were resuspended and passed over 40 μm cell strainers, and the retained microvessels were digested with collagenase and DNase I. After washing, the microvessel fraction from each brain was divided between five wells of a 96-well filter plate and co-incubated with LR-BSL8.4a cells overnight, prior to β-galactosidase staining.
B. Brain microvessel cross-presentation results from naïve mice and mice 7 days post-infection with PbA, PbNK65 or Py17X. Bars represent means of 3–4 mice/group. **p < 0.01, ***p < 0.001, ANOVA with Bonferroni's post-test on log-transformed numbers. Results are representative of three experiments.
C. Brain-sequestered leukocytes from naive mice and mice 7 days post-infection with PbA or Py17X were purified and co-incubated with LR-BSL8.4a cells overnight prior to β-galactosidase staining. The brain microvessel cross-presentation assay was performed on additional PbA-infected mice at the same time. Bars represent means of 3–5 mice/group. *p < 0.05, **p < 0.01, ****p < 0.0001, ANOVA with Bonferroni's post-test on log-transformed total spot counts arising from each brain.
D,E. Scanning electron microscopy images of brain microvessel fragments from mice infected 7 days previously with PbA. Scale bars indicate 1 µm.
D. Brain microvessel before collagenase digestion, not mixed with LR-BSL8.4a cells.
E. Digested microvessel co-incubated with LR-BSL8.4a cells for 4 h.
F. Digested microvessel co-incubated with LR-BSL8.4a cells for 24 h. Curly braces indicate LR-BSL8.4a cells and arrowheads indicate apparent cell–cell junctions LR-BSL8.4a cells have formed with microvessels.

A. Brain microvessel cross-presentation results from naïve mice and mice 7 days post-infection with PyYMluc or PbA. Bars represent means of 2–4 mice/group. ***p < 0.01, ANOVA with Bonferroni's post-test on log-transformed total spot counts arising from each brain.
B–D. Parasitemia (B), head luminescence (C), and (D) luminescence of isolated and perfused brains from mice infected with PbAluc or PyYMluc. Parasitemia levels were determined at Days 5–7. Bars represent the mean ± SD. ***p < 0.01, Mann–Whitney test. Luminescence was measured at Day 7 post-infection. Bars represent the mean. **p < 0.01, t-test on values transformed with x′ = log(x + 1).

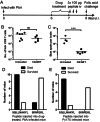
A. Experiment schedule for (D). Mice infected with PbA were treated with chloroquine and artesunate (CQ/ART) between 6 and 7 days p.i., then injected three times i.v., 4 h apart with 100 µg of either SQLLNAKYL peptide or control SIINFEKL peptide. They were injected with folic acid 8 days p.i. to test the integrity of the blood–brain barrier.
B,C. Mice infected with PbA were untreated or treated with CQ/ART between 6 and 7 days p.i., then sacrificed soon after.
B. Tetramer staining was performed on the brain-sequestered leukocytes. Bars represent medians. ns, not significant by Mann–Whitney test.
C. Microvessels were isolated from each brain and co-incubated with LR-BSL8.4a cells overnight. The total number of blue spots after β-galactosidase staining is reported. Bars represent means. ***p < 0.001, Student t-test on log-transformed data.
D. Mice subjected to the protocol in (A) either convulsed and died within 90 min or survived until the next day. p = 0.0033, Fisher's exact test.
E. Mice infected with Py17X were injected i.v. with 100 µg of either SQLLNAKYL or SIINFEKL peptide 7 days p.i., then challenged with folic acid 6 h later. p = 0.0047, Fisher's exact test.
Similar articles
-
Cross-presentation of malaria antigen by brain microvessels: why CD8(+) T cells are critical for the pathogenesis of experimental cerebral malaria.EMBO Mol Med. 2013 Jul;5(7):967-9. doi: 10.1002/emmm.201302849. Epub 2013 Jun 5. EMBO Mol Med. 2013. PMID: 23740752 Free PMC article. No abstract available.
-
Malaria-specific and nonspecific activation of CD8+ T cells during blood stage of Plasmodium berghei infection.J Immunol. 2008 Jul 15;181(2):1420-8. doi: 10.4049/jimmunol.181.2.1420. J Immunol. 2008. PMID: 18606696
-
Critical role of IL-33 receptor ST2 in experimental cerebral malaria development.Eur J Immunol. 2015 May;45(5):1354-65. doi: 10.1002/eji.201445206. Epub 2015 Mar 20. Eur J Immunol. 2015. PMID: 25682948
-
Cerebral malaria pathogenesis: Dissecting the role of CD4+ and CD8+ T-cells as major effectors in disease pathology.Int Rev Immunol. 2024;43(5):309-325. doi: 10.1080/08830185.2024.2336539. Epub 2024 Apr 15. Int Rev Immunol. 2024. PMID: 38618863 Review.
-
Unravelling the roles of innate lymphoid cells in cerebral malaria pathogenesis.Parasite Immunol. 2018 Feb;40(2). doi: 10.1111/pim.12502. Parasite Immunol. 2018. PMID: 29117626 Review.
Cited by
-
The plasma membrane calcium ATPase 4 does not influence parasite levels but partially promotes experimental cerebral malaria during murine blood stage malaria.Malar J. 2021 Jul 2;20(1):297. doi: 10.1186/s12936-021-03832-w. Malar J. 2021. PMID: 34215257 Free PMC article.
-
Evans blue dye-enhanced imaging of the brain microvessels using spectral focusing coherent anti-Stokes Raman scattering microscopy.PLoS One. 2017 Oct 19;12(10):e0185519. doi: 10.1371/journal.pone.0185519. eCollection 2017. PLoS One. 2017. PMID: 29049299 Free PMC article.
-
Targeting glutamine metabolism rescues mice from late-stage cerebral malaria.Proc Natl Acad Sci U S A. 2015 Oct 20;112(42):13075-80. doi: 10.1073/pnas.1516544112. Epub 2015 Oct 5. Proc Natl Acad Sci U S A. 2015. PMID: 26438846 Free PMC article.
-
Plasmodium falciparum histidine-rich protein II causes vascular leakage and exacerbates experimental cerebral malaria in mice.PLoS One. 2017 May 5;12(5):e0177142. doi: 10.1371/journal.pone.0177142. eCollection 2017. PLoS One. 2017. PMID: 28475625 Free PMC article.
-
Mycobacterium tuberculosis Coinfection Has No Impact on Plasmodium berghei ANKA-Induced Experimental Cerebral Malaria in C57BL/6 Mice.Infect Immun. 2015 Dec 7;84(2):502-10. doi: 10.1128/IAI.01290-15. Print 2016 Feb. Infect Immun. 2015. PMID: 26644378 Free PMC article.
References
-
- Amani V, Vigario AM, Belnoue E, Marussig M, Fonseca L, Mazier D, Renia L. Involvement of IFN-gamma receptor-medicated signaling in pathology and anti-malarial immunity induced by Plasmodium berghei infection. Eur J Immunol. 2000;30:1646–1655. - PubMed
-
- Amante FH, Haque A, Stanley AC, de Labastida Rivera F, Randall LM, Wilson YA, Yeo G, Pieper C, Crabb BS, de Koning-Ward TF, et al. Immune-mediated mechanisms of parasite tissue sequestration during experimental cerebral malaria. J Immunol. 2010;185:3632–3642. - PubMed
-
- Bagai R, Valujskikh A, Canaday DH, Bailey E, Lalli PN, Harding CV, Heeger PS. Mouse endothelial cells cross-present lymphocyte-derived antigen on class I MHC via a TAP1- and proteasome-dependent pathway. J Immunol. 2005;174:7711–7715. - PubMed
Publication types
MeSH terms
Substances
Grants and funding
LinkOut - more resources
Full Text Sources
Other Literature Sources
Research Materials

