Systemic ceramide accumulation leads to severe and varied pathological consequences
- PMID: 23681708
- PMCID: PMC3779446
- DOI: 10.1002/emmm.201202301
Systemic ceramide accumulation leads to severe and varied pathological consequences
Abstract
Farber disease (FD) is a severe inherited disorder of lipid metabolism characterized by deficient lysosomal acid ceramidase (ACDase) activity, resulting in ceramide accumulation. Ceramide and metabolites have roles in cell apoptosis and proliferation. We introduced a single-nucleotide mutation identified in human FD patients into the murine Asah1 gene to generate the first model of systemic ACDase deficiency. Homozygous Asah1(P361R/P361R) animals showed ACDase defects, accumulated ceramide, demonstrated FD manifestations and died within 7-13 weeks. Mechanistically, MCP-1 levels were increased and tissues were replete with lipid-laden macrophages. Treatment of neonates with a single injection of human ACDase-encoding lentivector diminished the severity of the disease as highlighted by enhanced growth, decreased ceramide, lessened cellular infiltrations and increased lifespans. This model of ACDase deficiency offers insights into the pathophysiology of FD and the roles of ACDase, ceramide and related sphingolipids in cell signaling and growth, as well as facilitates the development of therapy.
Copyright © 2013 The Authors. Published by John Wiley and Sons, Ltd on behalf of EMBO.
Figures
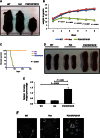
A photograph of 10-week-old wild-type (WT), heterozygous (Het), and Asah1P361R/P361R mice.
Growth curves measured in weights versus age (n = 10 of each genotype). Error bars represent standard errors of the mean.
Kaplan–Meier survival analysis (n = 16 for each genotype).
A photograph of spleens from each genotype.
Ratios of spleen weights to body weights (n = 5 for heterozygous (Het) and Asah1P361R/P361R mice; n = 3 for WT). Bars represent mean values. Error bars represent standard errors of the mean.
Brain MRI scans of 10-week-old WT, heterozygous, and Asah1P361R/P361R littermates. Hydrocephaly was detected in 5 out of 7 Asah1P361R/P361R mice. Arrows indicate dilated brain ventricles.
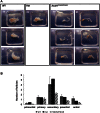
Pictures of ovaries from 9-week-old WT, heterozygous, and Asah1P361R/P361R mice showing size differences.
Analysis of follicular numbers at different stages in 9-week-old WT (n = 2), heterozygous (n = 1), and Asah1P361R/P361R mice (n = 3). This analysis of follicular numbers was done once. Bars represent mean values. Error bars represent standard errors of the mean.
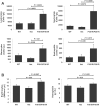
A,B. Blood samples were collected from all animals at 7–10 weeks. Total leukocyte, monocyte, neutrophil, and eosinophil counts were determined (A); and (B) erythrocytes and hemoglobin levels were measured in WT (n = 10), heterozygous (n = 7), and Asah1P361R/P361R mice (n = 9). The cell counts were measured once. Bars represent mean values. Error bars represent standard errors of the mean.
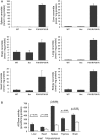
Samples from spleens, livers, brains, lungs, hearts, and kidneys of 7- to 10-week-old mice were analyzed for total ceramide using an E. coli DAG kinase assay (n = 2 for all genotypes). The data points represent the average values from two independent experiments. Bars represent mean values. Error bars represent standard errors of the mean.
Samples from livers, hearts, spleens, thymuses, and brains of 7- to 10-week-old mice were analyzed for ACDase activity by a liposome-based TLC assay using C12-NBD-Ceramide as the substrate at pH 4.6 (n = 3). This experiment was done once. Bars represent mean values. Error bars represent standard errors of the mean.
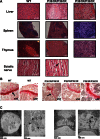
H&E staining of liver, spleen, thymus, and sciatic nerve of 7- to 10-week-old mice (arrow indicates infiltrating macrophages).
Safranin-O staining of femurs from 7-week-old mice shows thinner epiphyseal growth plates in Asah1P361R/P361R mice compared to a WT littermate (arrows).
Electron microscopy images of hepatic (left panel) and peripheral nerve (right panel) sections from Asah1P361R/P361R mice. Arrows indicate Farber bodies.
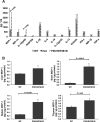
Serum cytokine levels in WT (n = 3), heterozygotes (n = 5), and Asah1P361R/P361R mice (n = 5). The levels of serum cytokines were measured once. Bars represent mean values. Error bars represent standard errors of the mean.
MCP-1 levels in lysates from livers, brains, spleens, and thymuses of Asah1P361R/P361R and WT mice (n = 4). The tissue MCP-1 levels were measured once. Bars represent mean values. Error bars represent standard errors of the mean.

A representative picture of 10-week-old LV/enGFP-WT, LV/enGFP-Asah1P361R/P361R, and LV/ACDase-Asah1P361R/P361R mice.
Growth curves measured in weights versus age for: LV/enGFP-WT (n = 8); LV/ACDase-WT (n = 7); LV/enGFP-Het and LV/ACDase-Het (n = 10); LV/enGFP-Asah1P361R/P361R (n = 8); and LV/ACDase-Asah1P361R/P361R (n = 7). Error bars represent standard errors of the mean.
Kaplan-Meier survival analysis for all treated genotypes: LV/enGFP-WT (n = 8); LV/ACDase-WT (n = 8); LV/enGFP-Het (16); LV/ACDase-Het (n = 34); LV/enGFP-Asah1P361R/P361R (n = 8); and LV/ACDase-Asah1P361R/P361R (n = 9).


Samples from spleens, livers, and brains of 10-week-old LV/enGFP-WT, LV/ACDase-WT, LV/enGFP-Asah1P361R/P361R, and LV/ACDase-Asah1P361R/P361R mice, and 14- to 16-week-old LV/ACDase-Asah1P361R/P361R mice were analyzed for total ceramide using mass spectrometry (n = 2 for all groups). The data points represent average values from two independent experiments. Bars represent mean values. Error bars represent standard errors of the mean.
H&E staining of spleen and liver from 10-week-old LV/enGFP-WT, LV/enGFP-Asah1P361R/P361R, and LV/ACDase-Asah1P361R/P361R mice (arrows indicate foamy macrophages).
Comment in
-
Farber disease: understanding a fatal childhood disorder and dissecting ceramide biology.EMBO Mol Med. 2013 Jun;5(6):799-801. doi: 10.1002/emmm.201302781. Epub 2013 May 13. EMBO Mol Med. 2013. PMID: 23666771 Free PMC article. No abstract available.
References
-
- Antonarakis SE, Valle D, Moser HW, Moser A, Qualman SJ, Zinkham WH. Phenotypic variability in siblings with Farber disease. J Pediatr. 1984;104:406–409. - PubMed
-
- Bar J, Linke T, Ferlinz K, Neumann U, Schuchman EH, Sandhoff K. Molecular analysis of acid ceramidase deficiency in patients with Farber disease. Hum Mutat. 2001;17:199–209. - PubMed
-
- Bielawska A, Perry DK, Hannun YA. Determination of ceramides and diglycerides by the diglyceride kinase assay. Anal Biochem. 2001;298:141–150. - PubMed
Publication types
MeSH terms
Substances
Grants and funding
LinkOut - more resources
Full Text Sources
Other Literature Sources
Medical
Molecular Biology Databases
Research Materials
Miscellaneous

