

ERBB4 confers metastatic capacity in Ewing sarcoma
- PMID: 23681745
- PMCID: PMC3721475
- DOI: 10.1002/emmm.201202343
ERBB4 confers metastatic capacity in Ewing sarcoma
Abstract
Metastatic spread is the single-most powerful predictor of poor outcome in Ewing sarcoma (ES). Therefore targeting pathways that drive metastasis has tremendous potential to reduce the burden of disease in ES. We previously showed that activation of the ERBB4 tyrosine kinase suppresses anoikis, or detachment-induced cell death, and induces chemoresistance in ES cell lines in vitro. We now show that ERBB4 is transcriptionally overexpressed in ES cell lines derived from chemoresistant or metastatic ES tumours. ERBB4 activates the PI3K-Akt cascade and focal adhesion kinase (FAK), and both pathways contribute to ERBB4-mediated activation of the Rac1 GTPase in vitro and in vivo. ERBB4 augments tumour invasion and metastasis in vivo, and these effects are blocked by ERBB4 knockdown. ERBB4 expression correlates significantly with reduced disease-free survival, and increased expression is observed in metastatic compared to primary patient-matched ES biopsies. Our findings identify a novel ERBB4-PI3K-Akt-FAK-Rac1 pathway associated with aggressive disease in ES. These results predict that therapeutic targeting of ERBB4, alone or in combination with cytotoxic agents, may suppress the metastatic phenotype in ES.
Keywords: ERBB4; Ewing sarcoma; FAK; Rac1; metastasis.
© 2013 The Authors. Published by John Wiley and Sons, Ltd on behalf of EMBO.
Figures

Heat-map reveals increased ERBB4 expression across most exons in CHLA-10 compared to CHLA-9 ES cells; data show n = 5 repetitions.
ErbB4 expression levels were analyzed by Western blot in CHLA-9 and CHLA-10 cells cultured under M or S conditions. Actin was used as a loading control. One of three representative experiments is shown.
ERBB4 isoforms expression was analyzed by qPCR in CHLA-9 and CHLA-10 cells grown as M or S, using ERBB4 TaqMan probes. Graphs represent mean ± SD of three independent experiments with two replicates each (*p < 0.05; **p < 0.01; ***p < 0.005). Specific numerical p-values for these and all subsequent experiments are itemized in Supporting Information Table S6.
ERBB4 isoforms expression in samples from eight ES cell lines grown as M or S was evaluated by TaqMan qPCR. Top depicting JM-a and JM-b, and bottom CYT-1 and CYT-2 expression; n = 3 in duplicate.
ERBB4 expression levels were analyzed by Western blotting in a panel of ES cell lines. Actin was used as a loading control. One of three representative experiments is shown.

A. Akt phosphorylation on Ser-473, Thr-308 or total Akt expression levels were evaluated by immunoblotting in CHLA-9 and CHLA-10 cells grown under M or S conditions. Blots are representative of n = 3 independent experiments.
B,C. Targeting ERBB4 with 1410 and 1411 shRNA constructs reduced Akt phosphorylation in CHLA-10, CHLA-25 and SK-N-MC metastatic ES cells. One of three representative experiments is shown.
D. Metastatic ES cell lines were growth as monolayer in serum-stimulated (M), serum-starved (SS) or spheroid (S) conditions for 24 h. ERBB4, p-Akt and total Akt levels were evaluated by Western blot; n = 3 independent experiments.
E. ERBB4 kd reduced Akt activation in metastatic ES cell lines growth as M or SS conditions; n = 3 independent experiments.

A. Confluent monolayers of CHLA-9 and CHLA-10 ES cells transduced with 1410 and 1411 ERBB4 shRNA constructs were wound-scratched and allowed to migrate for 30 h. The graph shows migration distance vs. time values ± SD of six independent experiments.
B–E. Uncoated (B), or Matrigel-coated transwells (C–E) were used to analyze the contribution of ERBB4 to B, the cell migration, and C–E, invasion processes in control, or in ERBB4 kd CHLA-9, CHLA-10, SK-N-MC and CHLA-25 cells. Graphs represent mean ± SD of four independent experiments; ***p < 0.005.
F. Overexpression of ERBB4 in CHLA-9 and TC-32 ES cells significantly increases cell invasion; n = 3, *p < 0.05, ***p < 0.005.

A. Rac1 and Cdc42 GTPase activities were measured by pull-down assays in CHLA-9 and CHLA-10 Scramb, or ERBB4 kd cells growth as M or S. Data shown are representative of n = 3 experiments; *p < 0.05; **p < 0.01; ***p < 0.005.
B. Phalloidin (red) and Hoechst nuclear staining (blue) of CHLA-9, CHLA-10 and ERBB4 kd CHLA-10 cells are shown.
C. Graph shows quantification of cell spreading; at least 25 cells were scored per condition. Values represent percentage of the mean ± SD; n = 3, ***p < 0.005.
D. Active Rac1 and Cdc42 (GTP-bound) levels were evaluated in control CHLA-9 and CHLA-10 cells, or in CHLA-10 ERBB4 kd cells 2 h after spreading assays. Rac1 and Cdc42 from total lysates were used as loading controls. Data shown are representative of three independent experiments; *p < 0.05.
E,F. GTP-bound Rac1 levels were evaluated by pull-down assays in CHLA-9 control or CHLA-9/ERBB4 cells, and in CHLA-10 cells treated with different inhibitors. Cells were growth under: (E) anchorage independent (S), or (F) cell spreading conditions. Rac1 from total lysates was used as a loading control. Graphs represent mean ± SD of three independent experiments; *p < 0.05, ***p < 0.005.
G. Total p-Tyr and FAK Tyr397 phosphorylation were assessed by immunoprecipitation in CHLA-9, CHLA-9/ERBB4, CHLA-10 and CHLA-10 ERBB4 kd cells, during cell spreading assays. Lysates were immunoprecipitated for endogenous FAK, and immunoblotted with p-Tyr, FAK Tyr397 or FAK Abs. One of three representative experiments is shown.
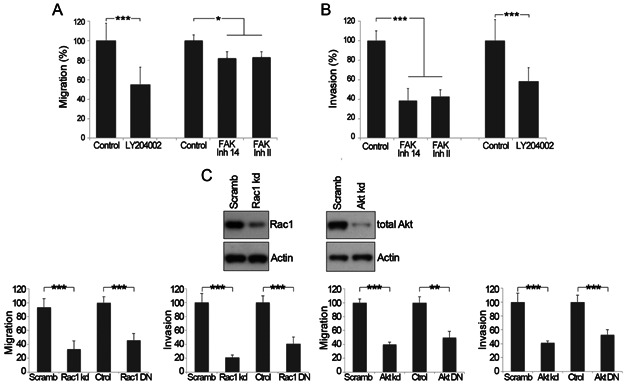
A,B. The contribution of PI3K and FAK to the cell migration, and invasion processes was analyzed in control CHLA-10 cells, or in CHLA-10 cells treated with LY294002, and FAKinhII or FAKinh14 inhibitors. Graphs represent mean ± SEM of three independent experiments; *p < 0.05, ***p < 0.005.
C. Knockdown of Rac1 and Akt, or transfection with Rac1 or Akt DN constructs reduced migration and invasion in CHLA-10 cells. Graphs represent mean ± SD of n = 3 experiments; **p < 0.01, ***p < 0.005.

A,E. Side-by-side view of low power H&E stained primary tumours from CHLA-10 and CHLA-10 ERBB4 kd (A), and CHLA-9 and CHLA-9/ERBB4 (E) implanted mice. Arrows in A and E point to highly infiltrative borders with direct invasion into adjacent normal kidney, whereas arrowheads point to the so-called “pushing” non-invasive borders.
B,F. The percentage of animals from each of these groups harbouring metastatic lesions was quantified (n = 8 animals/condition; *p < 0.05).
C,G. Representative H&E stained images of: (C) CHLA-10 and CHLA-10 ERBB4 kd, and (G) CHLA-9 and CHLA-9/ERBB4 pulmonary metastasis are shown.
D,H. The number and size of lung metastatic lesions from each of these groups were quantified; *p < 0.05.

A,B. Representative images of IHC staining for ERBB4 in primary tumours (upper panels), or metastatic lesions (lower panels) of CHLA-10, CHLA-10 ERBB4kd, CHLA-9 or CHLA-9/ERBB4 tumours are shown.
C. GTP-bound Rac1 levels were evaluated by pull-down assays in tumours from CHLA-10 and CHLA-10 ERBB4 kd mice; n = 3 mice per condition. Total Rac1, ERBB4 and p-Akt Ser-473 were additionally evaluated by immunoblotting. Graph represents Rac1 activity ± SEM; n = 3, *p < 0.05.
D. Lysates were immunoprecipitated for endogenous FAK, and immunoblotted with p-Tyr or FAK Abs. An isotype-matched antibody was used as a negative control. Graph represents FAK activity ± SEM; n = 3, *p < 0.05.

IHC was used to examined ERBB4 expression in 19 matched biopsies (primary tumours and metastatic sites) from the same patients; *p < 0.05.
The graph shows the percentage of ES patients displaying weak/absent versus strong/moderate ERBB4 expression in localized versus metastatic lesions; n = 19; p < 0.05.
Representative IHC images depicting ERBB4 staining in matched primary and the corresponding distant metastasis from two ES patients are shown. Scale bars = 50 µm.
ERBB4 immunoreactivity was analyzed by IHC in a TMA containing n = 94 clinical samples. High ERBB4 expression in the metastatic lesions was found in 81.3% patients versus 57.7% patients in the primary sites; p < 0.05.
Kaplan–Meier illustrating disease-free survival of ES patients, classified according to ERBB4 protein expression. Data show a significantly worse clinical outcome (p < 0.05) associated with high ERBB4 expression levels.
References
-
- Batra S, Reynolds CP, Maurer BJ. Fenretinide cytotoxicity for Ewing's sarcoma and primitive neuroectodermal tumor cell lines is decreased by hypoxia and synergistically enhanced by ceramide modulators. Cancer Res. 2004;64:5415–5424. - PubMed
-
- Bernstein ML, Devidas M, Lafreniere D, Souid AK, Meyers PA, Gebhardt M, Stine K, Nicholas R, Perlman EJ, Dubowy R, et al. Intensive therapy with growth factor support for patients with Ewing tumor metastatic at diagnosis: Pediatric Oncology Group/Children's Cancer Group Phase II Study 9457--a report from the Children's Oncology Group. J Clin Oncol. 2006;24:152–159. - PubMed
-
- Braunreiter CL, Hancock JD, Coffin CM, Boucher KM, Lessnick SL. Expression of EWS-ETS fusions in NIH3T3 cells reveals significant differences to Ewing's sarcoma. Cell Cycle. 2006;5:2753–2759. - PubMed
Publication types
MeSH terms
Substances
Grants and funding
LinkOut - more resources
Full Text Sources
Other Literature Sources
Medical
Molecular Biology Databases
Research Materials
Miscellaneous
