. 2013 Jan 1;32(1):96-127.
doi: 10.1080/0144235X.2012.751175.

Partial cooperative unfolding in proteins as observed by hydrogen exchange mass spectrometry

Affiliations

Partial cooperative unfolding in proteins as observed by hydrogen exchange mass spectrometry

John R Engen et al. Int Rev Phys Chem. .

Abstract

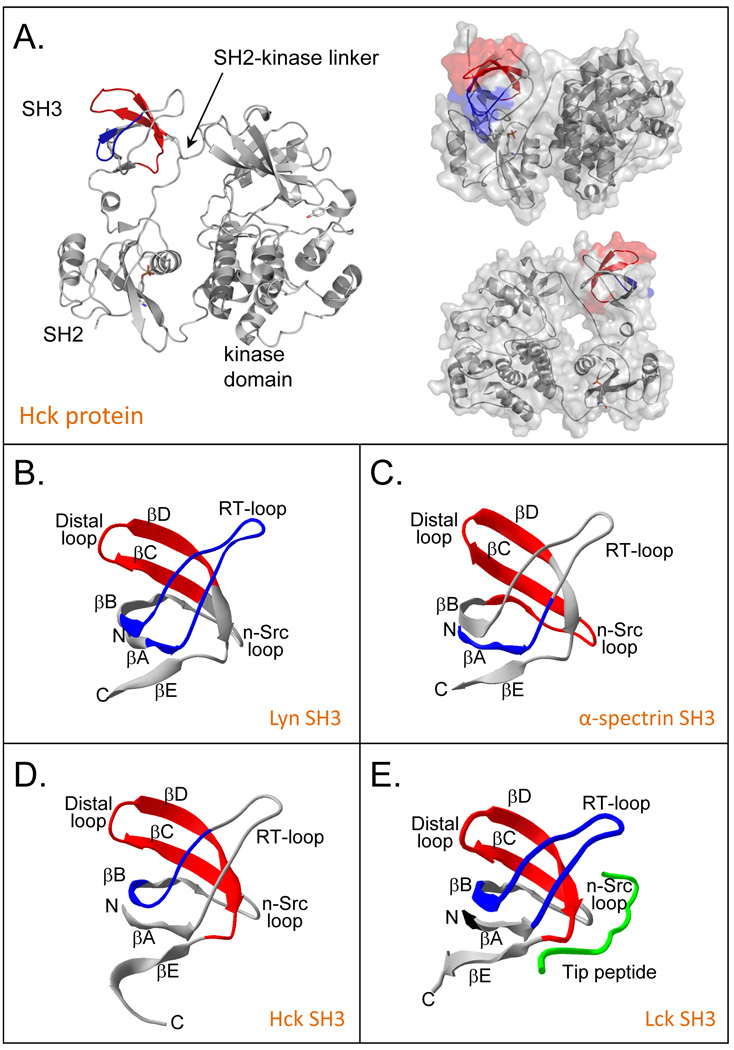
Many proteins do not exist in a single rigid conformation. Protein motions, or dynamics, exist and in many cases are important for protein function. The analysis of protein dynamics relies on biophysical techniques that can distinguish simultaneously existing populations of molecules and their rates of interconversion. Hydrogen exchange (HX) detected by mass spectrometry (MS) is contributing to our understanding of protein motions by revealing unfolding and dynamics on a wide timescale, ranging from seconds to hours to days. In this review we discuss HX MS-based analyses of protein dynamics, using our studies of multi-domain kinases as examples. Using HX MS, we have successfully probed protein dynamics and unfolding in the isolated SH3, SH2 and kinase domains of the c-Src and Abl kinase families, as well as the role of inter- and intra-molecular interactions in the global control of kinase function. Coupled with high-resolution structural information, HX MS has proved to be a powerful and versatile tool for the analysis of the conformational dynamics in these kinase systems, and has provided fresh insight regarding the regulatory control of these important signaling proteins. HX MS studies of dynamics are applicable not only to the proteins we illustrate here, but to a very wide range of proteins and protein systems, and should play a role in both classification of and greater understanding of the prevalence of protein motion.

Keywords: Abl; HDX; Hck; Lck; SH2 domain; SH3 domain; Src-family kinase; deuterium; protein dynamics, flexibility.


Figures

Figure 1
Figure 1
The distinctive appearance of EX2 and EX1 kinetics in hydrogen exchange mass spectrometry. With increasing amounts of time in D2O, the extremes of the (A) EX2 and (B) EX1 kinetic limits are distinguishable for both proteins and peptides. In EX2, due to random protein fluctuations, the rate of refolding (k−1) (see Equation 1) is much larger than the rate of labeling (k2) and the exchange is classified as uncorrelated. Such exchange produces a single population of molecules that gradually gain mass during the timecourse of the labeling experiment. In EX1, k2 is much larger than k−1 and regions of the protein can all become labeled before refolding (k−1) occurs. This type of exchange is termed correlated as all residues in a region undergoing EX1 appear to have exchanged at the same time. In the mass spectra of EX1, there are two peaks: one for the population that did not yet unfold and become deuterated (at lower m/z) and one for the population that did unfold and become deuterated (at higher m/z). This Figure was taken from [32].
Figure 2
Figure 2
Partial unfolding in human Hck SH3 as monitored by HX MS. (A) Transformed mass spectra (from Ref. [1]) of Hck SH3 after various times in D2O from 1 minute to 8 hours [including undeuterated (0%) and maximally deuterated (100%) controls]. A bimodal pattern after 22 minutes of labeling is accentuated with two uniform Gaussian distributions: the lower-mass distribution is indicated with a green arrow and represents molecules that have not yet unfolded and become deuterated; the higher-mass distribution is indicated with a red arrow and represents molecules that have undergone partial cooperative unfolding and been labeled with deuterium. These mass spectra were acquired with instrument resolution of ~2,500, which is low relative to more recent data such as in Figure 6 which were obtained with nearly ~10,000 resolution. (B) The area of the lower-mass distribution (indicated with green) of an EX1 pattern is used to monitor the disappearance of the folded/undeuterated species along the time course of the labeling experiment. (C) The rate constant of unfolding and the unfolding half-life for an EX1 event can be determined with the equation shown. The slope of the line fit to the data yields the rate constant. In this example, partial unfolding in Hck SH3 was monitored at the times shown and compared to unfolding in the Hck SH3 domain when bound to the HIV Nef peptide (see [1] and main text for details).
Figure 3
Figure 3
Cartoon models to summarize all of the constructs of human Hck that have been used to study regulation and dynamics by HX MS. (A) SH3 alone with various peptide ligands; (B) the SH32 construct with various ligands; (C) the near full-length protein, HckYEEI, in cartoon form (left) and the crystal structure [60] of the down-regulated form (right).
Figure 4
Figure 4
The slowdown factor of unfolding in Hck SH3 for various constructs. Slowdown factor is the ratio of the unfolding rate in bound protein over the unfolding rate in free protein. A small slowdown factor (close to one) means weak or no binding, while a large slowdown factor means tight binding. The constructs involved in each experiment are shown in cartoon form. In cases of interaction with Nef and the Nef-derived peptide, the percentage of SH3-bound molecules is indicated by the superscripts a and b. Further details on the proteins used to produce this data can be found in [20,55].
Figure 5
Figure 5
Partial unfolding of various SH3 domains and measured by HX MS [66]. The measured half-life of unfolding and relative residue involvement were determined as described in Figure 2. Yes and Fyn SH3 domains did not undergo partial unfolding, hence their half-life of unfolding is shown as infinity, with no residue involvement.
Figure 6
Figure 6
Mass spectral peak width as it relates to EX1 kinetics. (A) The various ways in which EX1 can be seen in mass spectra, from well resolved peaks to peak shoulders [32]. The two deconvoluted and resolved peaks are shown on the left and the merged peaks, as observed in raw spectra, are shown on the right. The bars (open at 50% peak intensity and solid at 20% peak intensity) are the same width in all panels. (B) Unresolved EX1 signatures are apparent in the spectra for intact Lck SH3 (left panel) and the Lck SH3 peptide representing residues 44–61 (right panel) [72]. The dotted lines in the left panel are to guide the eye. The inset indicates how two Gaussian distributions fit under the raw data for the intact protein spectra after 10 seconds in deuterium. These mass spectra were acquired with instrument resolution of ~10,000, which higher than older data (Figure 2A) acquired with instrument resolution of ~2,500. (C) The peak width can be used to determine unfolding half-life. The entire width of the isotope distribution is measured, usually at 50% or 20% peak height. In this example, the width at 50% peak intensity is shown by the orange line. The orange line is the same width for both spectra to illustrate how the lower spectrum (Y Da wide) is much more narrow than the upper spectrum (X Da wide). These spectra are taken from part B (top=50 sec, bottom=1000 sec). The peak width (this time at 20% peak intensity) versus time is plotted as shown (bottom graph) and the apex, which represents the t1/2 of unfolding, is determined from the intersection of tangents to the peak on the log scale (red lines) (see [73,105] for details). (D) Deuterium incorporation (i, ii) and peak width-plots (iii, iv) for the unresolved EX1 data on Lck SH3 in part B. These data were taken from Ref. [72]. (E) Examples of using peak width to detect protein:ligand interactions. In this example, the Lck SH3 domain alone (solid symbols) and Lck SH3 bound to a high-affinity peptide from the HVS Tip protein (open symbols) were compared. The residues of each peptide are indicated in the top right of each graph. Lck SH3 domain binding slows unfolding as indicated by the shifts of the peak-width plots to the right upon binding. These data were taken from Ref. [72].
Figure 7
Figure 7
HX MS of the Lck protein. (A) Deuterium uptake curves for selected peptic peptides of Lck (solid triangles), Lck + ATP (open circles), Lck + Tip (solid red squares), and Lck + Tip + ATP (green diamonds). Also shown for peptide 42–59 is the deuterium uptake curve for the free SH3 domain of Lck (blue squares) [72]. The residues of each peptide are indicated in the upper left corner of each plot. The maximum of the vertical axis in each graph is the maximum number of exchangeable amide hydrogens. In all these experiments, LckYEEI [56,75] was used. (B) Peak width plot for Lck peptide 42–59, measured at 20% of peak maximum. (C) Regions of the Lck SH3 domain that experienced alterations in deuterium incorporation in response to Tip and/or ATP binding. The structure shown is a homology model for Lck based on the structure of down-regulated Hck (PDB 1QCF, [60]).
Figure 8
Figure 8
Measurements of unfolding half-life in the Abl SH3 domain for various constructs and mutants. In all these plots, large solid black symbols indicate the average unfolding half-life from the individual determinations (small white diamonds). The number of replicates of each measurement is shown on the right of each graph. (A) Unfolding was monitored for the constructs shown, bound to various ligands as indicated in the cartons on the left-hand side. For various lengths of linker, the sequence and linker nomenclature is indicated. These results were adapted from [73]. (B) Unfolding in various mutants of the Abl kinase linker. The wild-type linker sequence is shown on the top, indicated with cAbl. Each of the HAL linker sequences is shown. BP1 is a high-affinity Abl SH3 binding peptide (Kd = 2 µM, [93]). (C) Unfolding in various versions of Abl constructs containing the NCap (see [89] for crystal structure). These data were adapted from Ref. [83].
Figure 9
Figure 9
Summary of the effects of phosphorylation on Abl SH3 unfolding for various constructs. (A). Comparison of slowdown factor of free SH3 and SH3 incubated with BP1, both with and without phosphorylation by Hck. When Hck is present (as indicated with the -/+ symbols) Abl is phosphorylated at the positions indicated (see also [84]) by the blue dots in the cartoons at the bottom – Tyr89 (in SH3) and Tyr245 (in the SH2-kinase linker). (B). Comparison of slowdown factor as a function of phosphorylation in the constructs indicated. Mutants are indicated, with dYF being the double mutant of Y89F,Y245F. This figure is taken from Ref. [84].
Figure 10
Figure 10
Locations of peptides involved in SH3 domain unfolding. (A) Peptides 98–105 (blue) and 115–132 (red) of Hck SH3 in the context of the near full length down-regulated Hck kinase (PDB 1QCF, [60]). (B) Lyn SH3 (PDB 1W1F, [127]) residues 69–86 (blue), 100–111 (red). (C) α-spectrin SH3 (PDB 1U06, [128]) residues 964–977 (blue) and 995–1014 (red). (D) Hck SH3, derived from panel A (PDB 1QCF, [60]) residues 98–105 (blue) and 115–132 (red) and (E) Lck SH3 (PDB 1LCK, [129]) residues 16–33 (blue) and 44–61 (red). Parts of this figure were derived from Refs. [66] and [72].
Figure 11
Figure 11
ETD analysis of deuteration in the peptide 115–132 of Hck SH3. (A) The sequence of residues 115–132 with the c and z ion cleavage positions indicated. These c and z product ions were the only ones for which reliable data could be obtained; fragmentation of the C-terminal part of the peptide was not efficient. (B) Mass spectra of the +4 charge state of peptide 115–132 after 15 minutes of deuterium exchange (top). The low-mass region (blue bracket) and the high-mass region (red bracket) of the entire peak were independently selected for ETD using a quadrupole LM resolution setting of 15. The isolated ions are shown in the middle (red) and lower (blue) spectra; the combination of the red and blue spectra is shown in the inset. All spectra were obtained with a Waters Synapt G2 equipped with ETD using mild conditions that minimize deuterium scrambling [113]. (C) Deuterium content of the high- and low-mass selections according to the product ions of the c-type (top) and z-type (bottom).
Figure 12
Figure 12
Deuterium uptake plots and peak width analysis for peptides from the Hck SH3 W93A mutant. The sequence of the protein is shown at the left, with the 98–105 peptide colored in blue and the 115–132 peptide colored in red. The location of the mutation is shown in cyan – note the numbering of the mutation (W93A) is not in the same numbering scheme as the rest of the article, see Ref. [123]. (A,C) Deuterium uptake plots and (B,D) peak width plots for the two peptides, as indicated. The hatched box in panels B and D represents the time of the peak width maximum for wild type Hck SH3.

Similar articles

Cited by

References

    1. Engen JR, Smithgall TE, Gmeiner WH, Smith DL. Biochemistry. 1997;36(47):14384. - PubMed
    1. Linderstrom-Lang KU, Schellman JA. In: The Enzymes. Boyer PD, Lardy H, Myrbäck K, editors. Vol. 1. New York: Academic; 1959.
    1. Berger A, Linderstrom-Lang K. Arch Biochem Biophys. 1957;69:106. - PubMed
    1. Frauenfelder H, Parak F, Young RD. Annu Rev Biophys Biophys Chem. 1988;17:451. - PubMed
    1. Frauenfelder H, Sligar SG, Wolynes PG. Science. 1991;254(5038):1598. - PubMed

LinkOut - more resources