. 2013 Jun 1;5(2):159-171.
doi: 10.1007/s12551-013-0106-2.

Analytical Ultracentrifugation as a Tool for Studying Protein Interactions

Affiliations

Analytical Ultracentrifugation as a Tool for Studying Protein Interactions

Peter Schuck. Biophys Rev. .

Abstract

The last two decades have led to significant progress in the field of analytical ultracentrifugation driven by instrumental, theoretical, and computational methods. This review will highlight key developments in sedimentation equilibrium (SE) and sedimentation velocity (SV) analysis. For SE, this includes the analysis of tracer sedimentation equilibrium at high concentrations with strong thermodynamic non-ideality, and for ideally interacting systems the development of strategies for the analysis of heterogeneous interactions towards global multi-signal and multi-speed SE analysis with implicit mass conservation. For SV, this includes the development and applications of numerical solutions of the Lamm equation, noise decomposition techniques enabling direct boundary fitting, diffusion deconvoluted sedimentation coefficient distributions, and multi-signal sedimentation coefficient distributions. Recently, effective particle theory has uncovered simple physical rules for the co-migration of rapidly exchanging systems of interacting components in SV. This has opened new possibilities for the robust interpretation of the boundary patterns of heterogeneous interacting systems. Together, these SE and SV techniques have led to new approaches to study macromolecular interactions across the entire the spectrum of affinities, including both attractive and repulsive interactions, in both dilute and highly concentrated solutions, which can be applied to single-component solutions of self-associating proteins as well as the study of multi-protein complex formation in multi-component solutions.

Keywords: effective particle theory; global analysis; multi-protein complexes; multi-signal analysis; sedimentation equilibrium; sedimentation velocity.


Figures

Fig. 1
Fig. 1
Example for the change of equilibrium profile as a function of rotor speed in a multi-speed sedimentation equilibrium (SE) experiment and the benefit from implicit mass conservation constraints. A set of three samples in a dilution series of mixtures of a natural killer cell receptor fragment and its binding partner, the major histocompatibility complex class I protein (Dam et al. 2006) were brought to SE sequentially at rotor speeds of 15,000, 20,000, and 25,000 rpm and scanned at 280 and 250 nm. Shown are representative radial absorbance profiles of one sample acquired at 250 nm (symbols) and best-fit distributions (solid lines). Global fitting parameters were the macroscopic binding constants and the loading molar ratio of components common to all samples; local fitting parameters for each cell were the dilution factors of each sample and the best-fit bottom position (meniscus and bottom are represented in the plot as the limits of the abscissa). In the global analysis of three cells, the implicit mass conservation (Vistica et al. 2004) reduced the number of fitting parameters reflecting unknown protein concentrations from 18 to 4
Fig. 2
Fig. 2
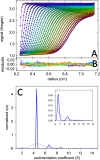
Sedimentation velocity data of a sample of bovine serum albumin and c(s) analysis. a Interference optical fringe profiles (every 5th scan and every 10th data point shown) at different point in time as indicated by color temperature. Solid lines are the best-fit model from c(s) analysis with maximum entropy regularization on a confidence level of P = 0.95, producing residuals as shown in b. c The corresponding c(s) distribution (blue) and, for comparison, the best-fit distribution ls-g*(s) (Schuck and Rossmanith 2000) without diffusional deconvolution (gray)
Fig. 3
Fig. 3
Example of the multi-signal c k(s) analysis of a triple protein mixture of a viral glycoprotein (green), its cognate receptor (blue), and a heterogeneous antigen–recognition receptor fragment (red). The content of each protein component in the different s-ranges is obtained from the global analysis of sedimentation data acquired with the interference optics and with the absorbance system at two different wavelengths (data not shown), using two chromophorically labeled proteins and one unlabeled protein. Solid lines show the c k(s) analysis of the triple mixture. The analogous distributions of each protein alone are shown as dashed lines. The formation of two coexisting binary complexes at ∼5 S and ∼7 S and a ternary complex with 1:1:1 stoichiometry at ∼8.5 S can be discerned. Figure reproduced from Schuck et al. (2010)
Fig. 4
Fig. 4
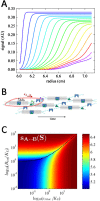
Sedimentation of rapidly reversible heterogeneous interactions. a Typical bimodal boundary pattern. Profiles are calculated using Lamm equation solutions, Eq. 6, for the sedimentation of a 40-kDa protein binding a 60-kDa protein with a kinetic off-rate constant of 0.1/s, at loading concentrations at a ratio 2:1:K D. Sedimentation was simulated at 50,000 rpm, and total absorbance profiles (assuming equal weight-based extinction coefficients of both components) are shown in 10-min intervals. b Cartoon of the effective particle AB (encircled in red). Indicated is the fractional time thatA (green) and B (blue) spend free or in complex (grayed time intervals). A spends a smaller fraction of time free than B, resulting in a match of their time-average velocities. An animated cartoon can be downloaded from https://sedfitsedphat.nibib.nih.gov/tools/Reaction%20Boundary%20Movies/Movies%20S1%20-%20S3.pdf, or created in the software SEDPHAT faithfully reflecting user-defined binding parameters and sedimentation coefficients. c Velocity of the reaction boundary AB as a function of the total loading concentration of a and b, calculated by effective particle theory. For more details, including tools for using these isotherms in the data analysis and experimental design, see Schuck (2010b)

Similar articles

Cited by

References

    1. Alami M, Dalal K, Lelj-Garolla B, Sligar SG, Duong F. Nanodiscs unravel the interaction between the SecYEG channel and its cytosolic partner SecA. EMBO J. 2007;26(8):1995–2004. doi: 10.1038/sj.emboj.7601661. - DOI - PMC - PubMed
    1. Ang S, Rowe AJ. Evaluation of the information content of sedimentation equilibrium data in self-interacting systems. Macromol Biosci. 2010;10(7):798–807. doi: 10.1002/mabi.201000065. - DOI - PubMed
    1. Aragon SR. Recent advances in macromolecular hydrodynamic modeling. Methods. 2011;54(1):101–114. doi: 10.1016/j.ymeth.2010.10.005. - DOI - PMC - PubMed
    1. Balbo A, Minor KH, Velikovsky CA, Mariuzza R, Peterson CB, Schuck P. Studying multi-protein complexes by multi-signal sedimentation velocity analytical ultracentrifugation. Proc Natl Acad Sci USA. 2005;102:81–86. doi: 10.1073/pnas.0408399102. - DOI - PMC - PubMed
    1. Balbo A, Brown P, Braswell E, Schuck P. Measuring protein-protein interactions by equilibrium sedimentation. Curr Protoc Immunol. 2007;18:18.8. - PubMed