. 2013 May 14:2:e00422.
doi: 10.7554/eLife.00422.

ER-associated mitochondrial division links the distribution of mitochondria and mitochondrial DNA in yeast

Affiliations

ER-associated mitochondrial division links the distribution of mitochondria and mitochondrial DNA in yeast

Andrew Murley et al. Elife. .

Abstract

Mitochondrial division is important for mitochondrial distribution and function. Recent data have demonstrated that ER-mitochondria contacts mark mitochondrial division sites, but the molecular basis and functions of these contacts are not understood. Here we show that in yeast, the ER-mitochondria tethering complex, ERMES, and the highly conserved Miro GTPase, Gem1, are spatially and functionally linked to ER-associated mitochondrial division. Gem1 acts as a negative regulator of ER-mitochondria contacts, an activity required for the spatial resolution and distribution of newly generated mitochondrial tips following division. Previous data have demonstrated that ERMES localizes with a subset of actively replicating mitochondrial nucleoids. We show that mitochondrial division is spatially linked to nucleoids and that a majority of these nucleoids segregate prior to division, resulting in their distribution into newly generated tips in the mitochondrial network. Thus, we postulate that ER-associated division serves to link the distribution of mitochondria and mitochondrial nucleoids in cells. DOI:http://dx.doi.org/10.7554/eLife.00422.001.

Keywords: ERMES; Gem1; Miro; S. cerevisiae; mitochondria; mitochondrial DNA.


Conflict of interest statement

JN, Reviewing editor, eLife.

The other authors declare that no competing interests exist.

Figures

Figure 1.
Figure 1.. ERMES marks sites of ER-associated mitochondrial division.
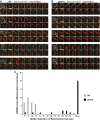
(A) A timelapse series of Mdm34-yEGFP and mito-DsRed. For clarity, the images represent a maximum projection of a 2-μm section of a cell that accurately represents a mitochondrial division observed in a single plane. The first frame represents a whole-cell projection containing an inset that is shown in the remaining frames. Below each frame of the timelapse series is a plot of pixel intensity vs distance (line-scan) of mito-DsRed fluorescence signal as indicated by the dashed line at 0 s. The range of the y-axis is 260 arbitratry units and the range of the x-axis is 151 pixels. (B) Quantification of ERMES-associated mitochondrial divisions in wild-type cells using data collected as described above. (C) ERMES foci are associated with ER tubules at mitochondrial division sites. Cells expressing Mdm34-yEGFP, DsRed-HDEL, and mito-TagBFP were imaged in a single plane every 10 s. The first frame represents a whole-cell projection containing an inset that is shown in the remaining frames. (D) ERMES foci are adjacent to Dnm1 at the mitochondrial division sites. Cells expressing Mdm34-yEGFP, Dnm1-mCherry, and mito-TagBFP were imaged in a single focal plane every 10 s (E) gem1Δ cells expressing GFP-2xFLAG-Gem1, Mdm34-mCherry, and mito-TagBFP were imaged in a single focal plane every 10 s. Expression of the mito-TagBFP construct in (CE) was induced by growing the cells overnight to mid-log phase in synthetic media containing 2% galactose. Scale bars, 2 μm. DOI: http://dx.doi.org/10.7554/eLife.00422.003
Figure 1—figure supplement 1.
Figure 1—figure supplement 1.. ERMES subunits colocalize at mitochondrial division sites.
(A) and (B) A wild-type strain expressing Mdm12-GFP (A) or Mmm1-GFP (B) and Mdm34-TdTomato from their endogenous loci and mito-TagBFP from an episomal plasmid was imaged over the course of 1.75 min on an OMX microscope as described in the ‘Materials and methods’. Scale bars, 2 μm. DOI: http://dx.doi.org/10.7554/eLife.00422.004
Figure 2.
Figure 2.. Gem1 is required for mitochondrial distribution during ER-associated mitochondrial division.
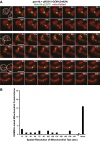
(A) ERMES foci are found at mitochondrial constriction sites in gem1Δ cells. Depicted is a whole-cell projection of gem1Δ cells expressing Mdm34-yEGFP and mito-DsRed. Arrowheads indicate mitochondrial constriction sites, which are also associated with Mdm34-yEGFP labeled foci. (B) The constriction sites associated with ERMES in gem1Δ cells are stable. gem1Δ cells expressing Mdm34-yEGFP and mito-DsRed were imaged as in Figure 1A. The first frame represents a whole-cell projection containing an inset that is shown in the remaining frames. Below each frame of the timelapse series is a plot of pixel intensity vs distance (line-scan) of mito-DsRed fluorescence signal as indicated by the dashed line at 0 s. The range of the y-axis is 260 arbitrary units and the range of the x-axis is 151 pixels. (C) Dnm1 is targeted to mitochondria in gem1Δ cells. A single focal plan in a timelapse series of a gem1Δ cell expressing GFP-HDEL, mito-tagBFP, and Dnm1-mCherry is shown. ER tubules also stably associate with mitochondrial constriction sites. Scale bars, 2 μm. DOI: http://dx.doi.org/10.7554/eLife.00422.005
Figure 2—figure supplement 1.
Figure 2—figure supplement 1.. ERMES-marked mitochondrial division is attenuated in gem1Δ cells.
(A) Five additional examples of ERMES-linked mitochondrial divisions in wild-type cells. (B) Five additional examples of ERMES-linked mitochondrial constrictions in gem1Δ cells. Cells expressing Mdm34-yEGFP and mito-DsRed were imaged as described in Figures 1A and 2C. Scale bars, 2 μm. (C) Frequency profile of mitochondrial resolution times following ERMES-linked constrictions in wild-type and gem1Δ cells. The interval is defined as the time from initial mitochondrial constriction to the time when mitochondrial tips move independently. Twenty-nine randomly selected events from both wild-type and gem1Δ cells were analyzed. ERMES-linked mitochondrial constrictions that persisted throughout the length of the image capture (210 s) are denoted as ‘never’ resolved. DOI: http://dx.doi.org/10.7554/eLife.00422.006
Figure 2—figure supplement 2.
Figure 2—figure supplement 2.. The first and second GTPase domains of Gem1 are required for its role in maintaining mitochondrial morphology.
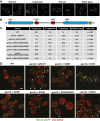
(A) Representative examples of mitochondrial morphology types that were used to categorize mitochondrial morphology phenotypes in gem1Δ mutants. (B) Schematic of Gem1 and the indicated mutations analyzed in this study. Blue boxes are GTPase domains; red boxes are EF-hand motifs; the green box is a transmembrane domain. (C) Percentages of each mitochondrial morphology class present in gem1Δ mutants and wild-type cells. (D) Representative examples of ERMES localization (Mdm34-yEGFP) and mitochondria (mito-DsRed) in wild-type cells and each of the gem1Δ mutants analyzed. Arrowheads mark ERMES-linked mitochondrial constrictions. The indicated mutations are specified in the top right corner of each panel. Scale bars, 2 μm. DOI: http://dx.doi.org/10.7554/eLife.00422.007
Figure 2—figure supplement 3.
Figure 2—figure supplement 3.. GTP hydrolysis by the second GTPase domain of Gem1 is required for mitochondrial distribution at ERMES-linked constrictions.
(A) Timelapse series of Mdm34-yEGFP and mito-DsRed with Gem1(S462N) expressed from pRS315 in a gem1Δ background. Cells were grown at 23°C in synthetic ethanol glycerol as in Figure 2—figure supplement 2B,C. Timelapse series are constructed as in Figure 2—figure supplement 2A,B. (B) Frequency profile of mitochondrial resolution times following ERMES-linked constrictions in gem1Δ + pRS315-Gem1(S462N) cells as in Figure 2—figure supplement 2C. Scale bars, 2 μm. DOI: http://dx.doi.org/10.7554/eLife.00422.008
Figure 3.
Figure 3.. Gem1 regulates ER–mitochondria contacts.
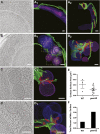
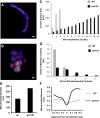
(A) A tomograph and (A1 and A2) corresponding three-dimensional tomogram of a mitochondrion (purple) and the ER (green) that closely apposes it (contact sites in red, defined as <30 nm distance and ribosome excluded) in a wild-type yeast cell. (B) Tomograph and (B1 and B2) three-dimensional tomogram of mitochondria (pink and purple) and ER (green, with contact shown in red) for a gem1Δ cell. Mitochondria are shown in multiple hues of purple to indicate mitochondria that are discontinuous within the reconstructed volume. Magnified tomographs and three-dimensional tomograms of the purple mitochondria (C and C1) and blue mitochondria (D and D1) shown in the boxed regions of B1 are shown. (E) Tomograms in (A, wild type) and (B, gem1Δ) were used to calculate the area of mitochondrial surfaces closely apposed to the ER (<30 nm, excludes ribosomes). The total mitochondrial surface area analyzed is similar for wild-type and gem1Δ cells (4.85 and 5.09 μm2, respectively). Cells lacking Gem1 possess more clustered and smaller ER–mitochondria contacts. (F) The total surface area was calculated for the mitochondria that were modeled and shown in (A, wild-type) and (B, gem1Δ), and the percent of this surface area that was in contact with the ER membrane was calculated for each. Mean diameter of the mitochondria shown in (A, wild-type) and (B, gem1Δ). Scale bars, 200 nm. DOI: http://dx.doi.org/10.7554/eLife.00422.009
Figure 3—figure supplement 1.
Figure 3—figure supplement 1.. Quantitative comparison of ER–mitochondria contacts in wild-type and gem1Δ cells.
Three-dimensional tomograms of mitochondria in wild-type (A) and gem1Δ (B) cells. The total mitochondrial surfaces measured were 4.85 and 5.09 μm2 in wild-type and gem1Δ cells, respectively. Mitochondria are shades of purple, each shade representing a separate organelle, and ER–mitochondria contact surfaces are shaded red. Scale bars, 200 nm. (C) The surface areas of individual ER–mitochondria contacts shown in (A) and (B). Although gem1Δ cells possess more ER–mitochondria contacts, the surface of each individual contact is smaller than the average ER-mitochondria contact in wild-type cells. (D) The shortest distance between pairs of ER–mitochondria contacts in wild-type and gem1Δ cells. Each category on the X-axis represents a different contact pair. (E) The diameters of mitochondria measured along their short axis. (F) Mitochondrial diameters were measured at and around ER-associated mitochondrial constriction sites in wild-type and gem1Δ cells. Although the diameter of mitochondria is larger in gem1Δ cells (E) and (F), the diameter of constricted mitochondria was similar (F). DOI: http://dx.doi.org/10.7554/eLife.00422.010
Figure 4.
Figure 4.. Nucleoid segregation is linked to mitochondrial division.
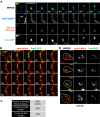
(A) Yme2-GFP coaligns with ERMES foci, marked by Mdm34-TdTomato, at mitochondrial division events. (B) Nucleoid behavior, marked by Yme2-yEGFP, at mitochondrial (mito-DsRed) division sites. (C) Quantification of the relationship of nucleoids to division sites. (D) Representative images of gem1Δ cells expressing Yme2-GFP and mito-DsRed. Scale bars, 2 μm, except in the inset of (B), which is 1 μm. DOI: http://dx.doi.org/10.7554/eLife.00422.015
Figure 4—figure supplement 1.
Figure 4—figure supplement 1.. Yme2-GFP is functional.
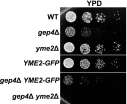
(A) The functionality of Yme2-GFP was assessed by exploiting the synthetic lethal phenotype on rich dextrose media caused by deletion of both YME2 and GEP4, which encodes a component of the cardiolipin biosynthetic pathway in mitochondria. Growth of gep4Δ cells on rich dextrose media was unaltered by expression of Yme2-GFP from its chromosomal locus, indicating that Yme2-GFP is functional. DOI: http://dx.doi.org/10.7554/eLife.00422.016
Figure 4—figure supplement 2.
Figure 4—figure supplement 2.. Yme2-GFP localizes to nucleoids.
(A) Chromosomally expressed Yme2-GFP in wild-type cells localized to punctate structures, which were also stained with the DNA selective vital dye DAPI and formed a beads-on-a-string pattern, characteristic of mitochondrial nucleoids. Scale bars, 2 μm. DOI: http://dx.doi.org/10.7554/eLife.00422.017
Figure 4—figure supplement 3.
Figure 4—figure supplement 3.. Additional examples of Yme2-GFP nucleoid behavior at a mitochondrial division sites in wild-type cells.
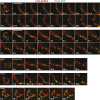
Imaging was performed as described in Figure 4B. Scale bars, 2 μm. DOI: http://dx.doi.org/10.7554/eLife.00422.018

Comment in

  • Make or break for mitochondria.
    Nezich CL, Youle RJ. Nezich CL, et al. Elife. 2013 May 14;2:e00804. doi: 10.7554/eLife.00804. Elife. 2013. PMID: 23682317 Free PMC article.

Similar articles

Cited by

References

    1. Boldogh I, Vojtov N, Karmon S, Pon LA. 1998. Interaction between mitochondria and the actin cytoskeleton in budding yeast requires two integral mitochondrial outer membrane proteins, Mmm1p and Mdm10p. J Cell Biol 141:1371–81 doi: 10.1083/jcb.141.6.1371 - DOI - PMC - PubMed
    1. Boldogh IR, Nowakowski DW, Yang HC, Chung H, Karmon S, Royes P, et al. 2003. A protein complex containing Mdm10p, Mdm12p, and Mmm1p links mitochondrial membranes and DNA to the cytoskeleton-based segregation machinery. Mol Biol Cell 14:4618–27 doi: 10.1091/mbc.E03-04-0225 - DOI - PMC - PubMed
    1. Bossy B, Petrilli A, Klinglmayr E, Chen J, Lutz-Meindl U, Knott AB, et al. 2010. S-Nitrosylation of DRP1 does not affect enzymatic activity and is not specific to Alzheimer’s disease. J Alzheimers Dis 20(suppl 2):S513–26 doi: 10.3233/JAD-2010-100552 - DOI - PMC - PubMed
    1. Boulanger J, Kervrann C, Bouthemy P, Elbau P, Sibarita JB, Salamero J. 2010. Patch-based nonlocal functional for denoising fluorescence microscopy image sequences. IEEE Trans Med Imaging 29:442–54 doi: 10.1109/TMI.2009.2033991 - DOI - PubMed
    1. Brachmann CB, Davies A, Cost GJ, Caputo E, LI J, Hieter P, et al. 1998. Designer deletion strains derived from Saccharomyces cerevisiae S288C: a useful set of strains and plasmids for PCR-mediated gene disruption and other applications. Yeast 14:115–32 doi: 10.1002/(SICI)1097-0061(19980130)14:2<115::AID-YEA204>3.0.CO;2-2 - DOI - PubMed

Publication types

MeSH terms