. 2013 Jun 12;13(6):2357-64.
doi: 10.1021/nl4008437. Epub 2013 May 21.

Manipulation and confinement of single particles using fluid flow

Affiliations

Manipulation and confinement of single particles using fluid flow

Melikhan Tanyeri et al. Nano Lett. .

Abstract

High precision control of micro- and nanoscale objects in aqueous media is an essential technology for nanoscience and engineering. Existing methods for particle trapping primarily depend on optical, magnetic, electrokinetic, and acoustic fields. In this work, we report a new hydrodynamic flow based approach that allows for fine-scale manipulation and positioning of single micro- and nanoscale particles using automated fluid flow. As a proof-of-concept, we demonstrate trapping and two-dimensional (2D) manipulation of 500 nm and 2.2 μm diameter particles with a positioning precision as small as 180 nm during confinement. By adjusting a single flow parameter, we further show that the shape of the effective trap potential can be efficiently controlled. Finally, we demonstrate two distinct features of the flow-based trapping method, including isolation of a single particle from a crowded particle solution and active control over the surrounding medium of a trapped object. The 2D flow-based trapping method described here further expands the micro/nanomanipulation toolbox for small particles and holds strong promise for applications in biology, chemistry, and materials research.


Figures

Figure 1
Figure 1
Single particles are confined and manipulated using an automated stagnation point flow generated at a microchannel junction. (a) Two opposing laminar streams meet at the junction, thereby generating a stagnation point where the local fluid velocity is exactly zero. A particle positioned at the stagnation point is effectively trapped. (b–c) A planar extensional flow can be expressed as a potential flow where the stagnation point represents a saddle point in the velocity potential. The stagnation point is a semi-stable equilibrium point, which is stable (unstable) along the inlet (outlet) streams. By implementing active flow control along the (unstable) outlet streams, a pseudo-potential well is created (as shown in (c)) to confine the particle.
Figure 2
Figure 2
Schematic of the manipulation mechanism for a single particle using an automated stagnation point flow. The position of the stagnation point can be manipulated in two dimensions by changing the relative flow rates of the inlet and outlet streams. As shown in (a) and (b), when the flow rate through the bottom channel is larger than the flow rate through the top channel, the stagnation point lies in the upper half of the junction. Similarly, when the flow rate through the left channel is larger than the right channel, the stagnation point lies in the right half of the junction ((b) and (d)). In this manner, fine-scale control of the stagnation point position enables manipulation of single particles in the microchannel junction.
Figure 3
Figure 3
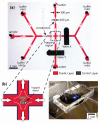
The 2-D microfluidic trap. (a) Optical micrograph of a microfluidic manipulation device. Single particles are confined at a predetermined location within the junction of two perpendicular microchannels (trapping region). Two on-chip membrane valves (black) positioned above one inlet channel and one outlet channel are used as metering valves to control the relative flow rates through the opposing channels (red). (b) Schematic of 2-D particle trapping. Two opposing laminar streams meet at the intersection of two perpendicular microchannels, thereby creating a well-defined flow field containing a stagnation point where an object is trapped. (c) The microfluidic manipulation device consists of a glass coverslip and a PDMS slab containing the microchannels and valves.
Figure 4
Figure 4
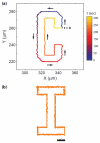
2-D micromanipulation of single particles using fluid flow. (a) Sample trajectory of a single particle (2.2 μm diameter Nile red fluorescent polystyrene bead) manipulated in two dimensions using the trap. A predetermined trajectory was programmed to spell the letter “C”. The manipulation starts at t=0 and ends when the particle returns to the initial point at t=300 seconds. (b) Sample trajectory of an individual particle tracing the letter “I” using the flow-based trapping and manipulation method. Scale bar: 10 μm.
Figure 5
Figure 5
Characterization of trap response. (a) Particle trajectories at four different strain rates. Top row: ε.=2.6s1 (purple), second row: ε.=5.1s1 (green), third row: ε.=7.7s1 (red), bottom row: ε.=10.3s1 (blue). At each strain rate, a single particle (500 nm diameter bead) is confined at three distinct positions along the inlet streams (x-axis). For clarity, the intervening trajectories between the three trapping positions are not shown. Particle trajectory along (b) the inlet and (c) the outlet streams at strain rate, ε.=2.6s1 (first row in (a) shown in purple). (d) Two-dimensional center-of-mass positions and the corresponding displacement histograms for the boxed trajectory in (a) at ε.=7.7s1. The standard deviation of particle displacement is < 1 μm (σx = 0.19 μm, σy = 0.22 μm). (e) Effect of strain rate ε. on particle displacement from the trap center along the inlet (RMSX) and outlet (RMSY) streams.
Figure 6
Figure 6
Shaping the effective potential of the 2-D microfluidic trap for a 500 nm bead. The two columns on the left show the distribution of particle displacement from the trap center along the inlet (X) and outlet (Y) streams at four different strain rates: (a) ε.=2.6s1, (b) ε.=5.1s1, (c) ε.=7.7s1, (d) ε.=10.3s1. In each case, the trap centers (X, Y) = (0,0) correspond to the first column of particle trajectories displayed in Figure 5a. The standard deviations (σx and σy) are obtained by fitting a Gaussian function (red curves) to the particle displacement data. Upon increasing the strain rate, the width of the distributions decreases (increases) along the inlet (outlet) streams. In the third column, the flow potential for the planar extensional flow as a function of strain rate is shown. In the fourth column, the effective trap potential for a 500 nm particle using the automated trap is shown. The shape of the pseudo potential well can be “tuned” by varying the strain rate.
Figure 7
Figure 7
(a) Isolation and confinement of a single particle from a crowded solution using the hydrodynamic trap. A solution containing fluorescent polystyrene particles (2.2 μm diameter) is introduced to the trapping area. One of the beads is effectively isolated and confined using the hydrodynamic trap, and the remainder of the untrapped beads in the sample is convected away by fluid flow within approximately 25 seconds following sample introduction. Yellow arrow shows the position of the trapped particle. Scale bar: 50 μm. (b) Dynamic control of the surrounding medium of a trapped particle. A single fluorescein-coated polystyrene particle (1.9 μm diameter) is trapped, and the surrounding medium is periodically exchanged in a preprogrammed manner between high pH (pH 8) and low pH (pH 4) buffer solutions. The intensity of fluorescence emission from the pH sensitive dye (fluorescein) fluctuates as the surrounding medium changes, thereby demonstrating the effectiveness of the buffer exchange in the trap.

Similar articles

Cited by

References

    1. Johann RM. Analytical and Bioanalytical Chemistry. 2006;385(3):408–412. - PubMed
    1. Nilsson J, Evander M, Hammarstrom B, Laurell T. Analytica Chimica Acta. 2009;649(2):141–157. - PubMed
    1. Yi CQ, Li CW, Ji SL, Yang MS. Analytica Chimica Acta. 2006;560(1–2):1–23.
    1. Ashkin A. Proceedings of the National Academy of Sciences. 1997;94(10):4853–4860. - PMC - PubMed
    1. Grier DG. Nature. 2003;424(6950):810–816. - PubMed

Publication types

MeSH terms