. 2013 May 17:14:337.
doi: 10.1186/1471-2164-14-337.

Integrative genomic analysis of CREB defines a critical role for transcription factor networks in mediating the fed/fasted switch in liver

Affiliations

Integrative genomic analysis of CREB defines a critical role for transcription factor networks in mediating the fed/fasted switch in liver

Logan J Everett et al. BMC Genomics. .

Abstract

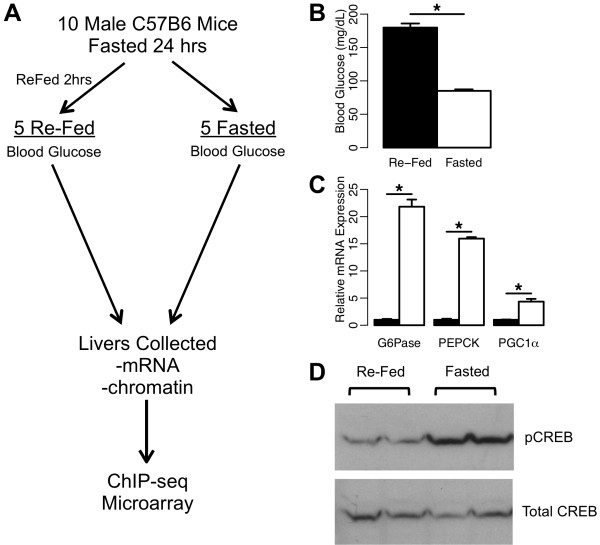
Background: Metabolic homeostasis in mammals critically depends on the regulation of fasting-induced genes by CREB in the liver. Previous genome-wide analysis has shown that only a small percentage of CREB target genes are induced in response to fasting-associated signaling pathways. The precise molecular mechanisms by which CREB specifically targets these genes in response to alternating hormonal cues remain to be elucidated.

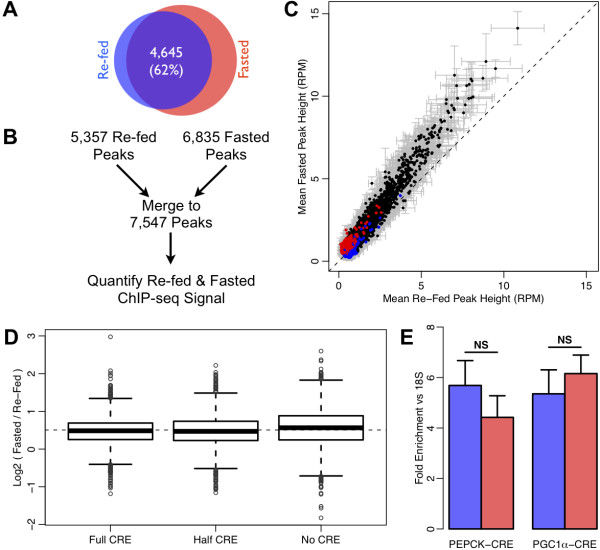
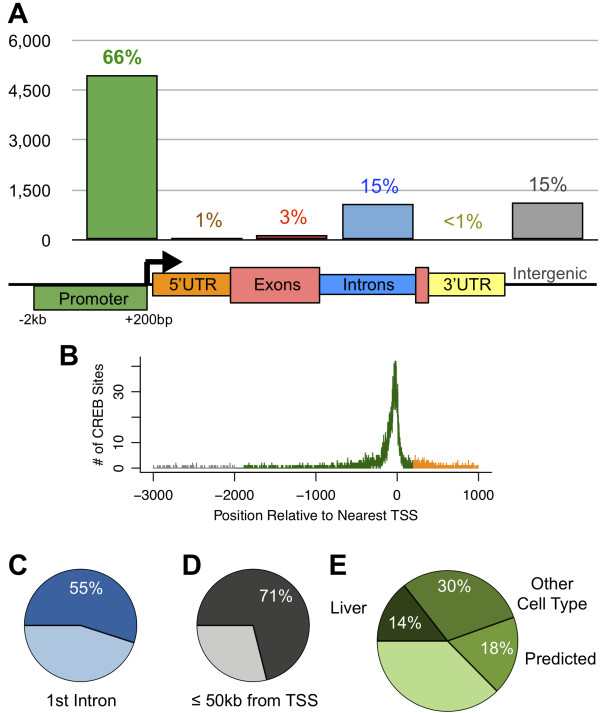
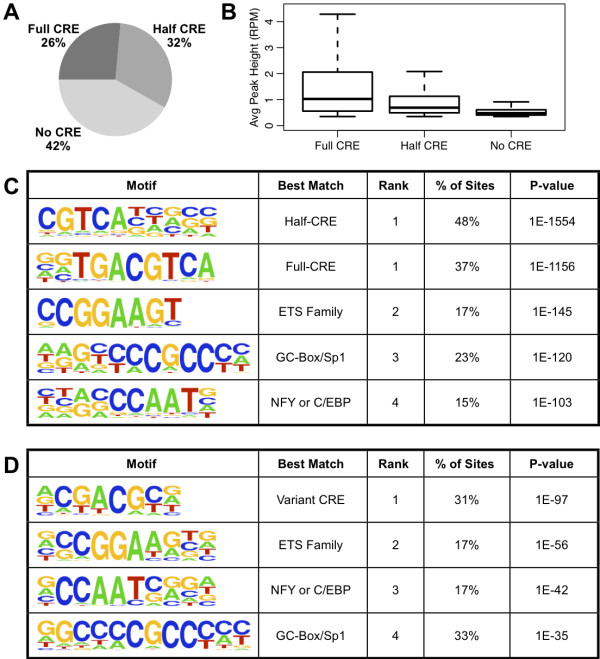
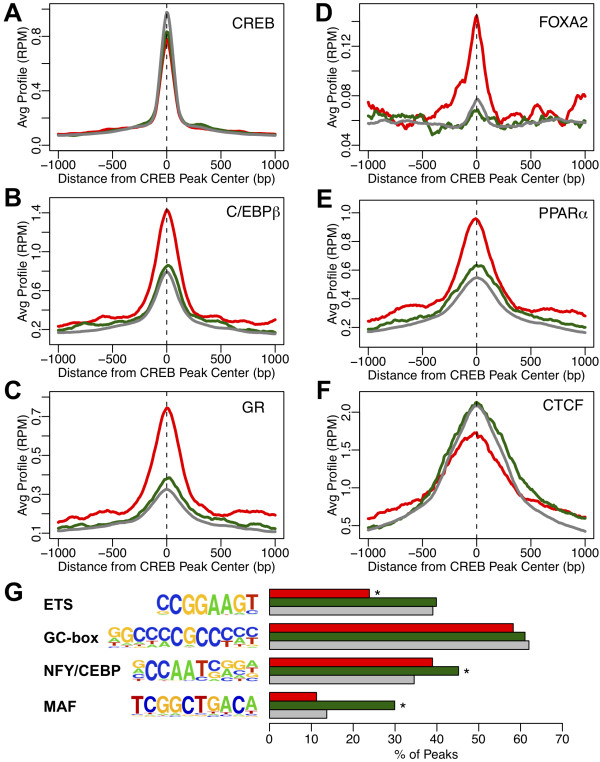
Results: We performed chromatin immunoprecipitation coupled to high-throughput sequencing of CREB in livers from both fasted and re-fed mice. In order to quantitatively compare the extent of CREB-DNA interactions genome-wide between these two physiological conditions we developed a novel, robust analysis method, termed the 'single sample independence' (SSI) test that greatly reduced the number of false-positive peaks. We found that CREB remains constitutively bound to its target genes in the liver regardless of the metabolic state. Integration of the CREB cistrome with expression microarrays of fasted and re-fed mouse livers and ChIP-seq data for additional transcription factors revealed that the gene expression switches between the two metabolic states are associated with co-localization of additional transcription factors at CREB sites.

Conclusions: Our results support a model in which CREB is constitutively bound to thousands of target genes, and combinatorial interactions between DNA-binding factors are necessary to achieve the specific transcriptional response of the liver to fasting. Furthermore, our genome-wide analysis identifies thousands of novel CREB target genes in liver, and suggests a previously unknown role for CREB in regulating ER stress genes in response to nutrient influx.


Figures

Figure 1
Figure 1
Experimental design and validation. A) Overview of experimental design. A cohort of 10 male C57BL/6J mice was fasted for 24 hours, then split into fasted and re-fed groups (n=5 each). The fasted mice were immediately sacrificed, while the re-fed group was given access to food for 2 hours before sacrificing. Blood glucose measurements were taken from all mice prior to sacrifice. Livers were collected shortly after sacrifice, and used for both mRNA and ChIP-seq experiments. B) Blood glucose was significantly higher in re-fed animals. Error bars indicate SEM, *p < 1E-4, one-tailed Student’s t-test. C) Known fasting-induced gluconeogenic genes are significantly induced in the fasted state (white bars) relative to the re-fed state (black bars) by RT-PCR. Error bars indicate SEM, *p < 0.005, one-tailed Student’s t-test). D) Western blot analysis of mouse livers shows that CREB is strongly phosphorylated on Ser133 after a 24 hr fast, but not after 2 hour re-feeding. Western blot was re-probed with an antibody for total CREB to validate equal loading.
Figure 2
Figure 2
Differential CREB binding analysis. A) Venn diagram of high-confidence CREB site calls in the re-fed (blue) and fasted (red) mouse liver suggests thousands of condition-specific binding events. B) Flowchart of quantitative analysis. C) Scatter-plot of average peak height (RPM = reads per million) across all fasted and re-fed replicates, for 7,547 merged peaks. Black dots correspond to peaks called in both conditions, red dots correspond to peaks called only in the fasted group, and blue dots correspond to peaks called only in the re-fed group. Gray error bars indicate SEM. D) Boxplot of log2 fasted/re-fed ratio of peak height for subsets of CREB binding sites based on occurrence of canonical full or half CRE sequence within 50 bp of peak center. E) ChIP-qPCR of CREB binding in the re-fed (blue) and fasted (red) groups on known fasting-induced CREB target genes. Neither change is significant at p-value of 0.05 threshold (one-tailed Student’s t-test).
Figure 3
Figure 3
Hepatic CREB binding relative to gene structure. A) The proportion of 7,547 high-confidence CREB binding sites with peak center in promoter regions (green, defined as -2 kb to +200 bp around TSS), 5’ UTR (orange), exons (red), introns (blue), and 3’ UTR (yellow). The remaining sites are considered intergenic (gray). B) Frequency of CREB binding site positions relative to known TSS. Colors correspond to feature definitions used in (A). C) Proportion of intronic CREB sites occurring in the first intron of a known transcript. D) Proportion of intergenic CREB sites occurring within 50 kb of a known TSS. E) We identified 7,095 genes bound by CREB at distal, proximal, or internal sites based on our high-confidence ChIP-seq peaks. Pie chart shows the proportion of target genes previously identified in liver cells [6], other mammalian cell types [6,32], or predicted by bioinformatics analysis [6]. The remaining 2,641 CREB-bound genes were not identified or predicted in the previous genome-wide studies.
Figure 4
Figure 4
Motif analysis of CREB binding sites. A) Percentage of binding sites containing a Full CRE (‘TGACGTCA’ with at most one mismatch), Half CRE only (‘TGACG’ exact match), or neither type of CRE within +/- 50 bp of peak center. B) Distribution of peak heights within each category of site identified by sequence content in (A). C) Top five de novo motifs returned by HOMER for the 7,547 high-confidence CREB binding sites in the liver. Sites with the same rank were clustered together as similar motifs by HOMER. Percentage of binding sites and P-value were calculated using the optimal motif score threshold as determined by HOMER. D) Top de novo motifs returned by HOMER for the 3,155 high-confidence CREB binding sites lacking a canonical CRE sequence in (A).
Figure 5
Figure 5
Enrichment of CREB binding around fasting-responsive genes. A) Heatmap of genes called as differentially expressed in fasted versus re-fed liver microarray experiment. Known fasting-inducible CREB targets are shown on top right. Selected feeding-inducible and ER stress genes are shown at bottom right. Number of genes and associated CREB sites are shown on left. B) For each gene category (fasting-induced in red, fasting-repressed in green, and all genes on the microarray in gray), we computed the percentage of genes containing 1, 2, or 3+ high-confidence CREB binding sites anywhere in the 10 kb TSS upstream region or the gene body (including introns). ~60% of regulated genes (both fasting-induced and fasting-repressed) have at least one CREB binding site by this criteria, while 33% of all genes on the array can be associated with at least one CREB binding site. *p-value < 1E-5 by Fisher’s Exact Test versus gray bars. NS indicates p-value > 0.05. A full listing of differentially expressed genes and associated CREB binding is provided in Additional file 2.
Figure 6
Figure 6
Association of CREB binding sites with fasting-responsive TATA-box containing promoters. CREB sites were separated into 3 groups: 285 sites associated with genes up-regulated in fasted state (red), 321 sites associated with genes down-regulated in fasted state (green), and 6,018 sites associated with genes that did not change (gray). A) Rates of CRE motif sequences (either full CRE or half CRE) identified for each group of CREB sites. *p-value < 0.05 by Fisher’s exact test versus the ‘No Change’ group. B) Rates of CREB sites, separated by association with fasting-dependent regulation, occurring in proximal promoter (−2 kb to +200 bp around TSS), distal promoter (−10 kb to -2 kb upstream of TSS), intronic, and exonic regions. *p-value < 0.001 by Fisher’s exact test compared to corresponding gray bar. C) All genes on our microarray were separated into groups based on associated CREB binding and presence of a TATA-box in the promoter. For each group, the percentage of genes induced (red) and repressed (green) in response to fasting is shown. *p-value < 1E-11, by Fisher’s Exact Test against the CREB-/TATA- group. NS indicates p-value > 0.05.
Figure 7
Figure 7
Association of CREB binding sites with additional transcription factor occupancy at fasting-responsive genes. CREB sites were separated into 3 groups: 285 sites associated with genes up-regulated in fasted state (red), 321 sites associated with genes down-regulated in fasted state (green), 6,018 sites associated with genes that did not change (gray). A-F) Average ChIP-seq profiles around each group of CREB binding sites are shown for CREB (A), CEBPB (B), NR3C1/GR (C), FOXA2 (D), PPARA (E), and CTCF (F). Corresponding distributions of peak heights are shown as box plots in Additional file 1: Figure S7 and tabulated in Additional file 3. G) Percentage of sites in each group containing the indicated motifs within +/− 250 bp of peak center. *p-value < 0.001 by Fisher’s exact test compared to gray bar.

Similar articles

Cited by

References

    1. Altarejos JY, Montminy M. CREB and the CRTC co-activators: sensors for hormonal and metabolic signals. Nat Rev Mol Cell Biol. 2011;12:141–151. doi: 10.1038/nrm3072. - DOI - PMC - PubMed
    1. Montminy MR, Gonzalez GA, Yamamoto KK. Regulation of cAMP-inducible genes by CREB. Trends Neurosci. 1990;13:184–188. doi: 10.1016/0166-2236(90)90045-C. - DOI - PubMed
    1. Sakamoto K, Karelina K, Obrietan K. CREB: a multifaceted regulator of neuronal plasticity and protection. J Neurochem. 2011;116:1–9. doi: 10.1111/j.1471-4159.2010.07080.x. - DOI - PMC - PubMed
    1. Wen AY, Sakamoto KM, Miller LS. The role of the transcription factor CREB in immune function. J Immunol. 2010;185:6413–6419. doi: 10.4049/jimmunol.1001829. - DOI - PMC - PubMed
    1. Koo S-H, Flechner L, Qi L, Zhang X, Screaton RA, Jeffries S, Hedrick S, Xu W, Boussouar F, Brindle P, Takemori H, Montminy M. The CREB coactivator TORC2 is a key regulator of fasting glucose metabolism. Nature. 2005;437:1109–1111. doi: 10.1038/nature03967. - DOI - PubMed

Publication types

Substances