. 2013 May 15;13(5):521-534.
doi: 10.1016/j.chom.2013.04.009.

Malaria-infected erythrocyte-derived microvesicles mediate cellular communication within the parasite population and with the host immune system

Affiliations

Malaria-infected erythrocyte-derived microvesicles mediate cellular communication within the parasite population and with the host immune system

Pierre-Yves Mantel et al. Cell Host Microbe. .

Abstract

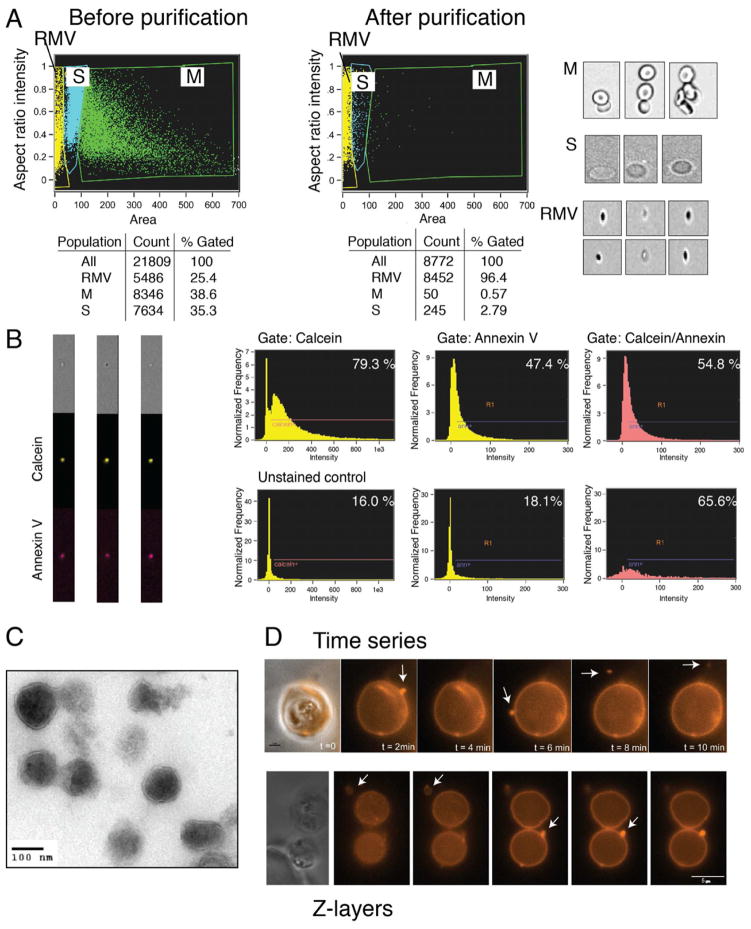
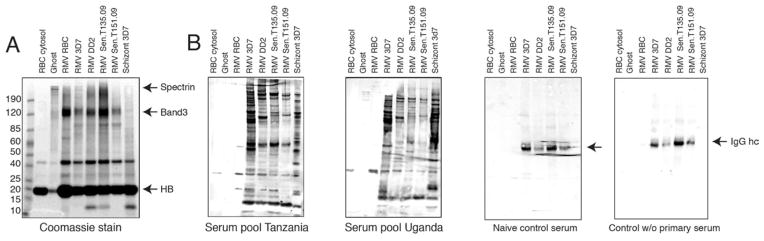
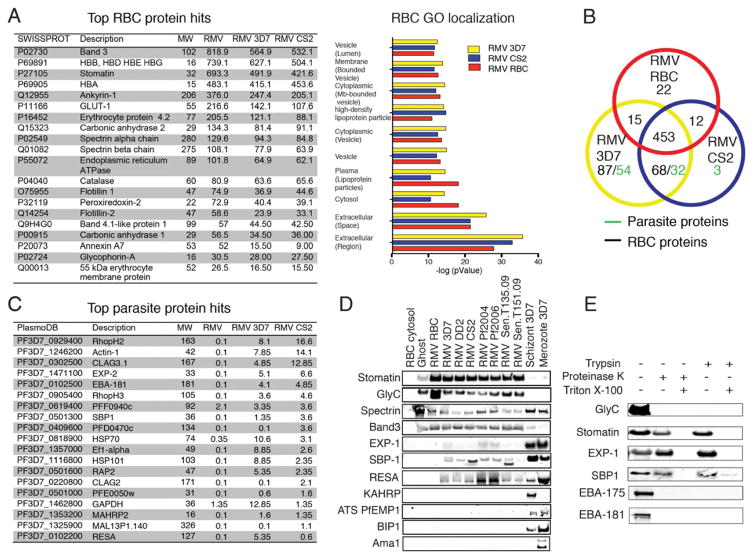
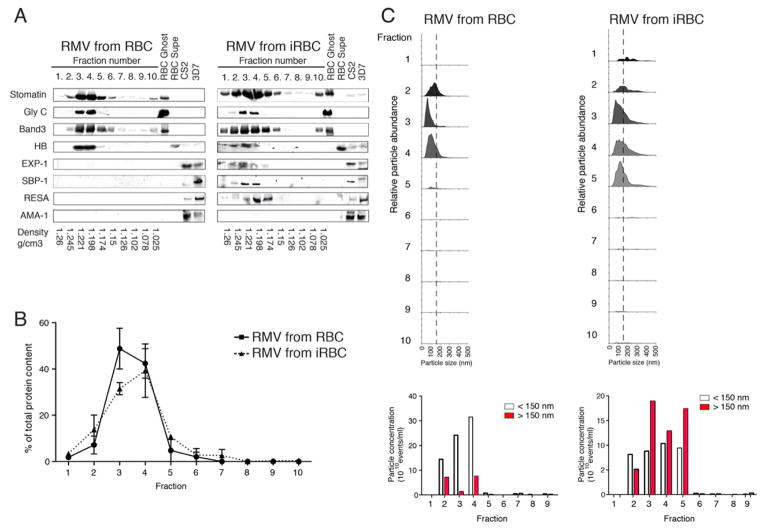
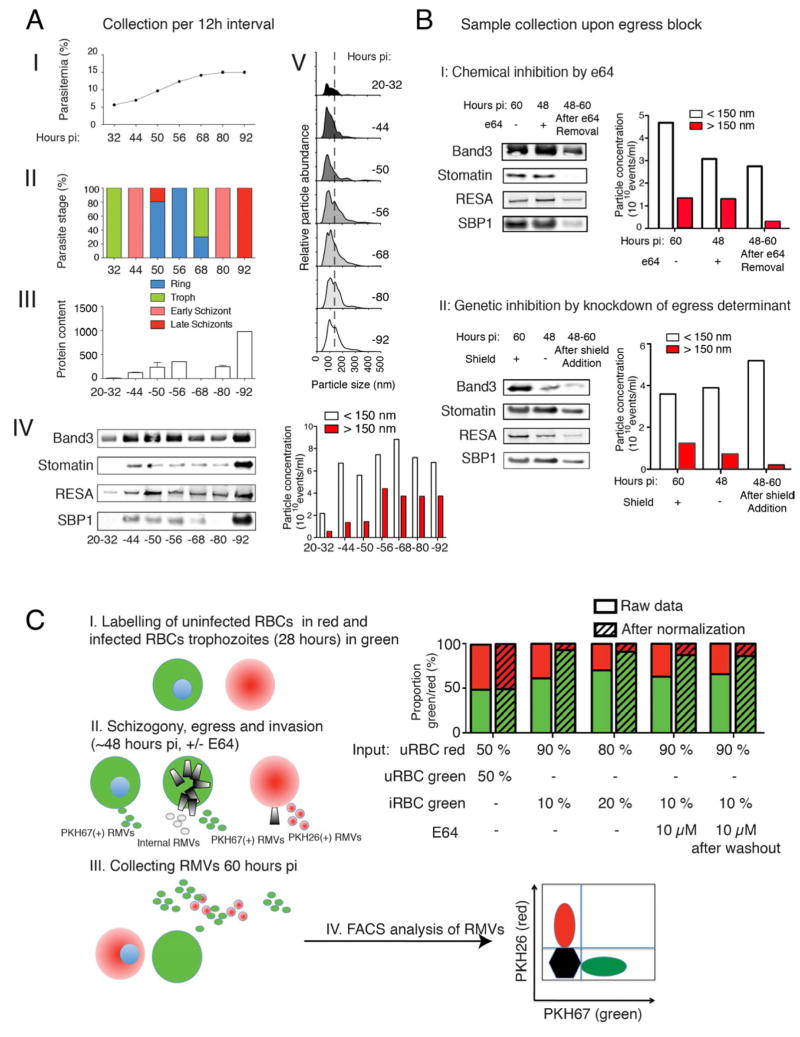
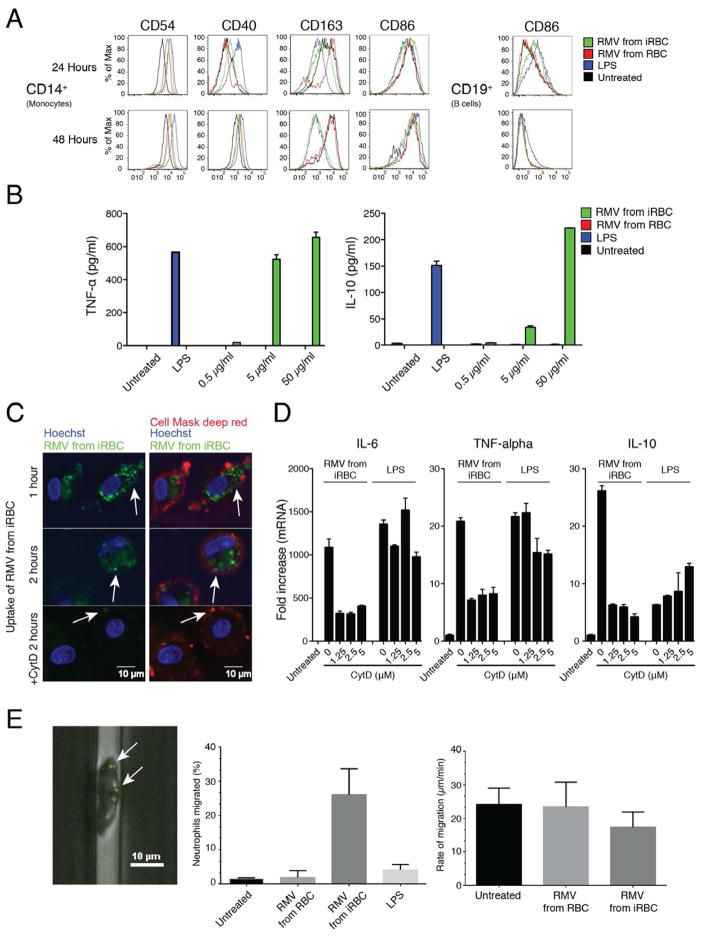
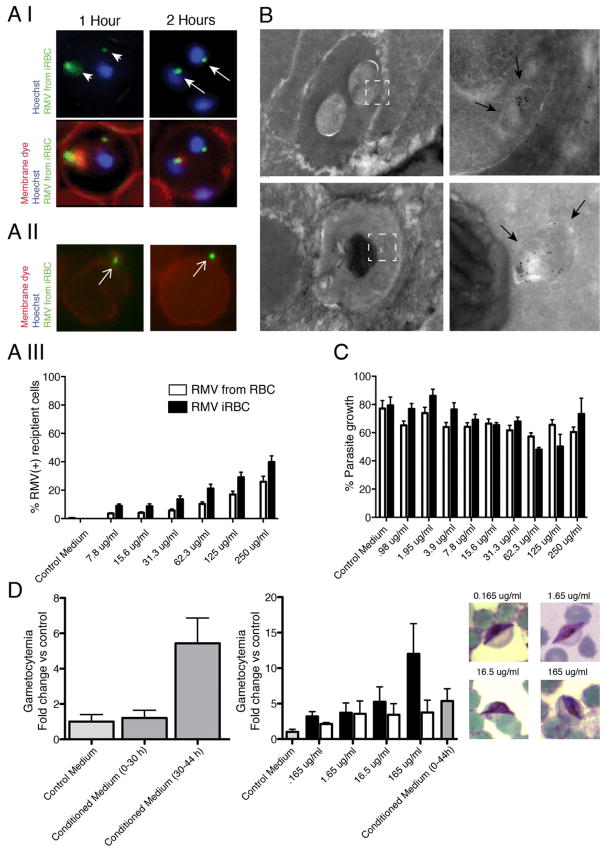
Humans and mice infected with different Plasmodium strains are known to produce microvesicles derived from the infected red blood cells (RBCs), denoted RMVs. Studies in mice have shown that RMVs are elevated during infection and have proinflammatory activity. Here we present a detailed characterization of RMV composition and function in the human malaria parasite Plasmodium falciparum. Proteomics profiling revealed the enrichment of multiple host and parasite proteins, in particular of parasite antigens associated with host cell membranes and proteins involved in parasite invasion into RBCs. RMVs are quantitatively released during the asexual parasite cycle prior to parasite egress. RMVs demonstrate potent immunomodulatory properties on human primary macrophages and neutrophils. Additionally, RMVs are internalized by infected red blood cells and stimulate production of transmission stage parasites in a dose-dependent manner. Thus, RMVs mediate cellular communication within the parasite population and with the host innate immune system.


Figures

Figure 1
Figure 1. related to Figure S1 and Movies S1. Initial characterization of RMVs from P. falciparum-infected red blood cells
A. Analysis of events by ImageStream before and after RMV purification. Non-fractionated cell suspension from in vitro culture was analyzed and three populations (S, M and RMV) were differentiated based on intensity and area. Image analysis demonstrates that M consists of clusters of multiple RBCs (“rosettes”), S consists of single RBCs and RMV consists of smaller events of vesicular nature. The RMV purification protocol resulted in an enrichment to > 95% of all events in the RMV gate. B. Calcein and annexin V labeling of RMVs. ImageStream analysis of calcein-AM and annexin V antibody staining demonstrates double labeling of RMVs (left panel). By flow cytometry approximately 55% of all events are double positive, although the real number is likely higher due to the limited sensitivity and size cut-off of flow cytometry (right panel). C. Characterization of the RMV population by electron microscopy. Analysis of fixed RMVs from P. falciparum in vitro cultures reveals vesicular structures of 100 – 400 nm. D. Live imaging of RMV release. Release was captured by time-lapse microscopy of infected RBCs labeled with the surface marker CellVue, using 2-minute intervals over the course of 2 hours (top panel). Serial images were taken across the z-plane by fluorescence microscopy of individual cells (bottom panel). In both cases multiple RMVs can be observed emerging from a single infected RBC.
Figure 2
Figure 2. Detection of parasite antigens in RMVs from iRBCs
A. Commassie Blue staining. RMV samples from four parasite strains, as well as control samples from parasite schizont stage lysate, RBC ghosts and RBC cytosol are analyzed. Shown are RMV and control samples, normalized by protein content, and 15 μg loaded onto a 4–12% SDS-PAGE gel per lane before Commassie staining. Note the partial or complete depletion of spectrin in RMV samples, while hemoglobin (HB) appears equally present across all samples. Unique bands are present in RMVs from iRBCs. B. Detection of parasite antigens by immunoblotting. Pooled serum from 20 malaria-infected individuals from Mbola, Tanzania (left panel) and Ruhiira, Uganda (right panel) was used for detection of parasite antigens. Multiple high molecular weight bands can be observed in the RMV samples that are absent from whole schizont lysates. Controls include serum from naïve individuals and immunoblot without primary antibody (serum). In both cases only IgG is detected. HB: Hemoglobin.
Figure 3
Figure 3. related to Figure S1 and Table S1. Compositional analysis of RMVs by proteomic profiling and immunoblotting
A. Most abundant RBC proteins as estimated by peptide counts. Left: The top 20 RBC proteins are ranked by peptide counts detected in RMVs from uRBCs (labeled RMV). These are compared with peptide counts in RMVs from iRBCs (parasite strains 3D7 or CS2). Apart from hemoglobin, the most abundant RBC proteins in all three samples are band 3 and stomatin. Right: Representation of all RBC protein hits identified after stratification by GO term enrichment analysis for cellular localization (additional graphs are available in Figure S2). B. Protein composition in the 3 samples analyzed. A Venn diagram representing total RBC and parasite proteins identified in the 3 samples is shown. Proteomics experiments are representative of 2 biological replicates performed in technical duplicates. C. Most abundant parasite proteins as estimated from peptide counts. Shown are the top 20 parasite proteins ranked by peptide counts that were identified in RMVs derived from iRBCs, from both parasite strains analyzed. Among the most abundant proteins are parasite invasion ligands (EBA-175, EBA-181) and RBC membrane-associated proteins (e.g., RhopH2/3, EXP-2, CLAG3.2, RESA, SBP1, MAHRP). D. Confirmation of RMV proteins by immunoblotting. RMVs are analyzed for the presence of parasite and host proteins that were identified by proteomic analysis. 4 RBC and 7 parasite markers are tested. These are the RBC membrane markers stomatin, glycophorin C and spectrin; the secreted parasite proteins Exp-1 (parasitophorous vacuole membrane and Maurer’s clefts), SPB1 (Maurer’s clefts), KAHRP (knobs on the iRBC surface), PfEMP1 (knobs on the iRBC surface) and RESA (RBC cytoskeleton and membrane), as well as the merozoite surface protein AMA1 and the parasite marker BIP (parasite ER). Glycophorin C appears to be reduced in RMVs from iRBCs; spectrin is reduced while stomatin is enriched in all RMVs compared to RBC ghosts. The same controls and parasite strains are analyzed as in Figure 3. Loading was normalized by using 8 μg of protein for each lane. E. Distribution of RBC and parasite proteins in RMVs using enzyme protection assays and immunoblotting. Four integral membrane proteins are analyzed: the two RBC surface proteins glycophorin C and stomatin, as well as the 2 parasite proteins SBP1 and Exp-1. We also investigated the localization of the 2 invasion ligands EBA-181 and EBA-175 to determine whether they peripherally associate with RMVs upon shedding during invasion. To test localization of these proteins, RMVs were treated with proteinase K or trypsin in the presence or absence of TX-100. By western blot analysis, glycophorin C as well as EBA-181 and EBA-175 are sensitive to enzyme treatment in the absence of the detergent TX-100, while the other 3 proteins are protected and therefore likely present within internal MV membranes.
Figure 4
Figure 4. Fractionation of RMVs on a linear sucrose gradient and subsequent analysis
RMVs were prepared as described in Figure S1A and loaded onto a linear sucrose gradient. For all analyses, equal volume of each fraction was analyzed, using fractions from uRBCs and iRBCs. A. Analysis of fractions by Western blot. The control samples include RBC ghosts, RBC supernatant and lysates from the 2 reference strains 3D7 and CS2. Membranes were probed with antibodies against stomatin, glycophorin C and band3, as well as Exp-1, SPB1, RESA and AMA-1. Hemoglobin (HB) was detected directly on the Coomassie gel. RMV markers peak in fractions 3 and 4, representing sucrose density between 1.22 (fraction 3) and 1.198 g/cm3 (fraction 4). AMA-1 is only detected in the parasite lysates but not in any sucrose fraction, suggesting that the RMV preparation that was loaded onto the gradient is not contaminated with merozoites. B. Analysis of fractions for protein content by BCA. RMVs showed a peak of protein content in fractions 3 and 4, suggesting that the populations were of homogenous density. Data are presented as mean ±SEM of three independent experiments. C. Analysis of size and quantity by NanoSight. Each sample was analyzed using the NanoSight technology to determine size distribution and relative quantity. RMV numbers peak in fractions 3 to 5, and those from infected RBCs contain an additional subpopulation of larger vesicles at 200 to 400 nm size.
Figure 5
Figure 5. related to Figure S3. Dynamics of RMV release during the asexual RBC cycle of P. falciparum
A. Analysis by collection of sample after incubation for time intervals. Highly synchronized parasite cultures (parasite strain 3D7) were initiated at low parasitemia and grown for varying hours post invasion (pi). RMV release was measured in specific time intervals by changing the medium at the beginning of the interval. At collection, parasite pellets were collected to determine parasitemia (I) and parasite stage distribution (II). Supernatant was collected for purification of RMVs and further analysis by BCA (III), western blot (IV) and Nanosight (V). The data demonstrate that the biggest increase in protein content (BCA) and RMV formation (Nanosight) coincides with late schizont stages (parasitemia). This also coincides with the peak in levels of RMV markers stomatin, band3, RESA and SBP1 in schizont stages. B. Genetic and chemical inhibition of egress to determine time point of RMV release. To determine whether the majority of RMVs is released before or during egress we blocked this process chemically by e64 or using a conditional knock-down strategy. I. Inhibition by the cysteine protease inhibitor e64. Addition of e64 does not inhibit RMV formation, as determined by Western blot probing for band3, stomatin, RESA and SBP1, and by NanoSight. II. Inhibition using genetic knock-down of CDPK5. Quantification of RMV formation after inhibition of egress by knock-down of CDPK5 function (Dvorin et al., 2010). Removal of shield in CDPK5-DD parasites does not reduce RMV formation, as measured by Western blot probing for the same markers as in the e64 experiment and by NanoSight. C. PKH labeling to determine the relative contribution of RMVs from iRBCs to total RMV production during in vitro culture. The set up of this experiment is represented in subpanels I-IV. I. Synchronized iRBCs (28h pi) are isolated by Percoll gradient, labelled with PKH67 (green) and mixed at different proportions (either 1/10 or 1/5) with uRBCs that have been labeled with PKH26 (red). II/III. After another invasion round (60h pi) supernatant is collected and RMVs purified. A subset of cells are incubated with e64 before egress and until 60h pi, or for 12h after which the compound is washed out and cells further cultured until 60h pi. IV. Red and green RMVs are quantified by flow cytometry. Shown are proportions as measured by flow cytometry, or after normalizing for the proportion of input cells (i.e., proportion of green iRBC versus uRBCs). After normalization, an approximately 10-fold excess of RMVs from iRBCs over those from uRBCs is consistently observed.
Figure 6
Figure 6. related to Figure S4. Immune stimulatory activity of RMVs
A. Activation of PBMCs. Quantification of activation markers per cell type by flow cytometry. Multiple markers are up-regulated in monocytes as well as CD86 in B cells. B. Activation of macrophages. TNF-α and IL-10 production by stimulated macrophages was measured by performing ELISA on the supernatant. Data are presented as mean ±SD and are representative of three independent experiments. C. RMV uptake into human macrophages. Human macrophages were stimulated for 1 or 2 h with RMV isolated from iRBC culture supernatants in the presence or absence of cytochalasin D (2.5 μM); cell membranes were stained with fluorescent Cell Mask Deep Red (red) and nuclei were stained with Hoechst 33342 dye (blue), followed by analysis of PKH67-labeled RMV uptake (green). Scale bars, 10 μm. Multiple internalized green vesicles can be observed in the absence of CytD, while RMVs are only present on the macrophage surface upon CytD treatment (white arrows). D. Inhibition of macrophage RMV phagocytosis. IL-6, TNF-α and IL-10 transcription by macrophages stimulated with RMVs from iRBCs and uRBCs in the presence or absence of cytochalasin D was assessed by real-time PCR. Data are presented as mean ±SD and are representative of three independent experiments. E. Neutrophil activation by RMVs. Pre-incubation of neutrophils with RMVs from iRBCs shows strong activation, while LPS and RMVs from uRBCs have a minor effect (left panel). Neutrophils activated by RMVs from iRBCs have a reduced migration rate compared to those from uRBCs and untreated controls (right panel). RMVs attached to a neutrophil incubated in the device are shown in the image on the left. White arrows show PKH67-labeled RMVs. Data are presented as mean ±SD and are representative of three independent experiments.
Figure 7
Figure 7. related to Figure S5. RMV uptake and gametocyte production
A. Live analysis of RMV internalization into RBCs. PKH67 labeled RMVs are incubated with RBCs and uptake into live cells is analyzed after 1 and 2 hours incubation by fluorescence microscopy (panels I and II) or flow cytometry (panel III). Uptake into infected RBCs can readily be detected as vesicular structures accumulate in the host cell and at the parasite periphery after 1 hour of incubation, and in a perinuclear location after 2 hours (white arrows). Flow cytometry data are presented as mean ±SD of four independent experiments. B. Ultrastructural analysis of RMV internalization. Biotinylated RMVs are incubated with RBCs for 24 hours and prepared for immunogold labeling. Labeled vesicles are detectable in the parasite, within larger membrane structures (black arrows), suggesting that they have not been internalized by endocytosis-like membrane fusion events. C/D. RMV Effect on parasite growth and gametocyte formation. No significant alteration of parasite growth is detectable after one replication cycle (C). Data are presented as mean ±SD of four independent experiments. Incubation of infected RBCs with RMVs derived from infected RBCs increases gametocyte formation in a dose-dependent manner (D). Likewise conditioned medium from late stage parasites but not from early stage parasites stimulates gametocyte formation. Data are presented as mean ±SEM of three independent experiments. Representative gametocytes captured at the time point of readout are shown.

Comment in

References

    1. Abu Bakar N, Klonis N, Hanssen E, Chan C, Tilley L. Digestive-vacuole genesis and endocytic processes in the early intraerythrocytic stages of Plasmodium falciparum. Journal of cell science. 2010;123:441–450. - PubMed
    1. Alano P. Plasmodium falciparum gametocytes: still many secrets of a hidden life. Molecular microbiology. 2007;66:291–302. - PubMed
    1. Blisnick T, Morales Betoulle ME, Barale JC, Uzureau P, Berry L, Desroses S, Fujioka H, Mattei D, Braun Breton C. Pfsbp1, a Maurer’s cleft Plasmodium falciparum protein, is associated with the erythrocyte skeleton. Molecular and biochemical parasitology. 2000;111:107–121. - PubMed
    1. Buchholz K, Burke TA, Williamson KC, Wiegand RC, Wirth DF, Marti M. A high-throughput screen targeting malaria transmission stages opens new avenues for drug development. The Journal of infectious diseases. 2011;203:1445–1453. - PMC - PubMed
    1. Butler KL, Ambravaneswaran V, Agrawal N, Bilodeau M, Toner M, Tompkins RG, Fagan S, Irimia D. Burn injury reduces neutrophil directional migration speed in microfluidic devices. PLoS ONE. 2010;5:e11921. - PMC - PubMed

Publication types

MeSH terms