

Fibrosis reduces severity of acute-on-chronic pancreatitis in humans
- PMID: 23684709
- PMCID: PMC3964816
- DOI: 10.1053/j.gastro.2013.05.012
Fibrosis reduces severity of acute-on-chronic pancreatitis in humans
Abstract
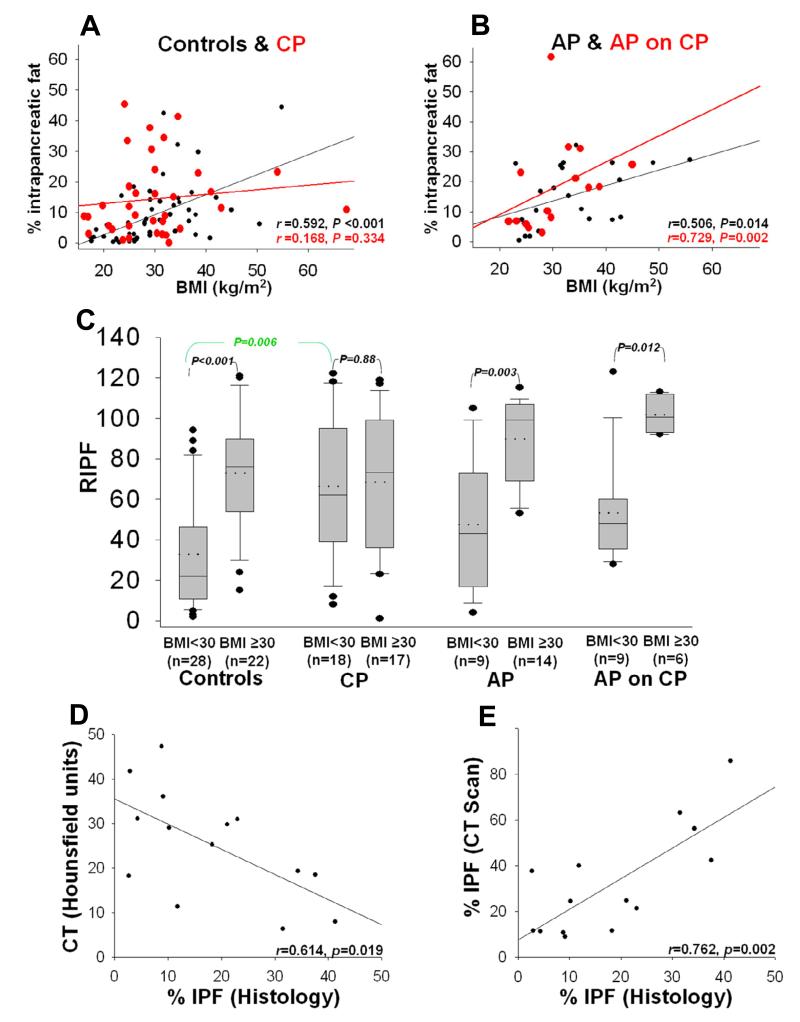
Background & aims: Acute pancreatitis (AP) and chronic pancreatitis (CP) share etiologies, but AP can be more severe and is associated with a higher rate of mortality. We investigated features of CP that protect against severe disease. The amount of intrapancreatic fat (IPF) is increased in obese patients and fibrosis is increased in patients with CP, so we studied whether fibrosis or fat regulate severity of AP attacks in patients with CP.
Methods: We reviewed records from the University of Pittsburgh Medical Center/Presbyterian Hospital Autopsy Database (1998-2008) for patients with a diagnosis of AP (n = 23), CP (n = 35), or both (AP-on-CP; n = 15). Pancreatic histology samples from these patients and 50 randomly selected controls (no pancreatic disease) were analyzed, and IPF data were correlated with computed tomography data. An adipocyte and acinar cell Transwell coculture system, with or without collagen type I, was used to study the effects of fibrosis on acinar-adipocyte interactions. We studied the effects of nonesterified fatty acids (NEFAs) and adipokines on acinar cells in culture.
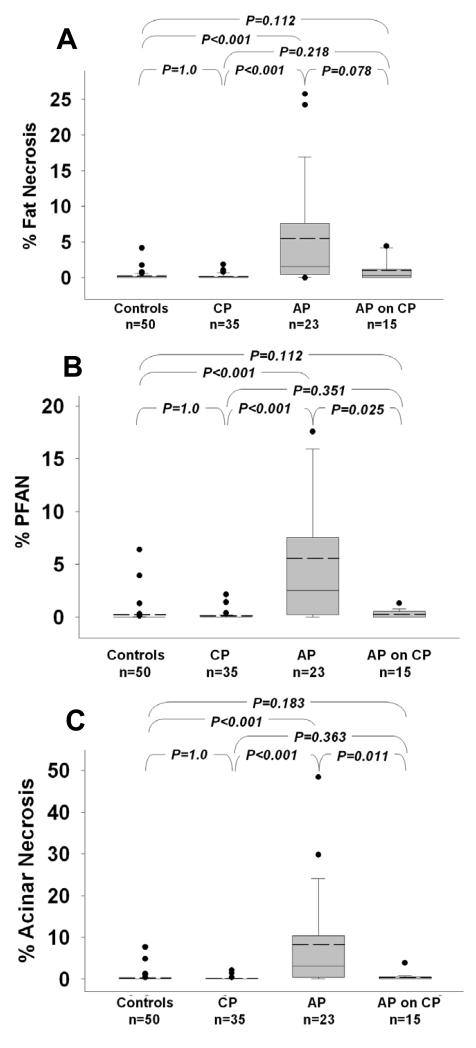
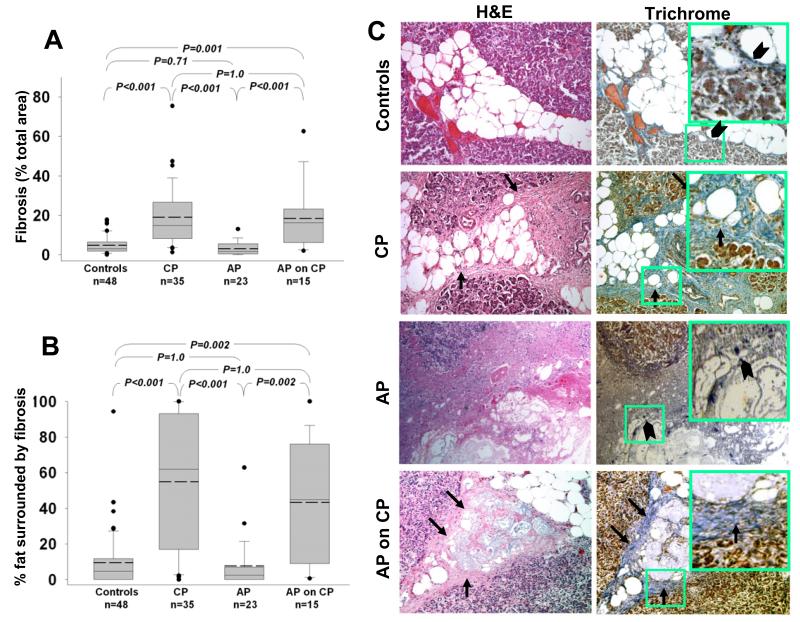
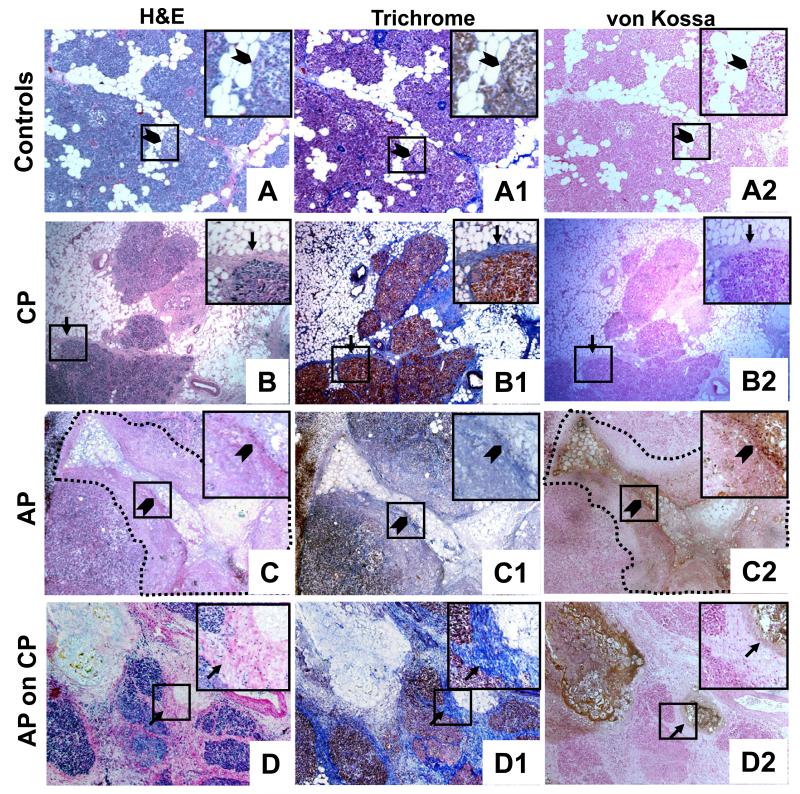
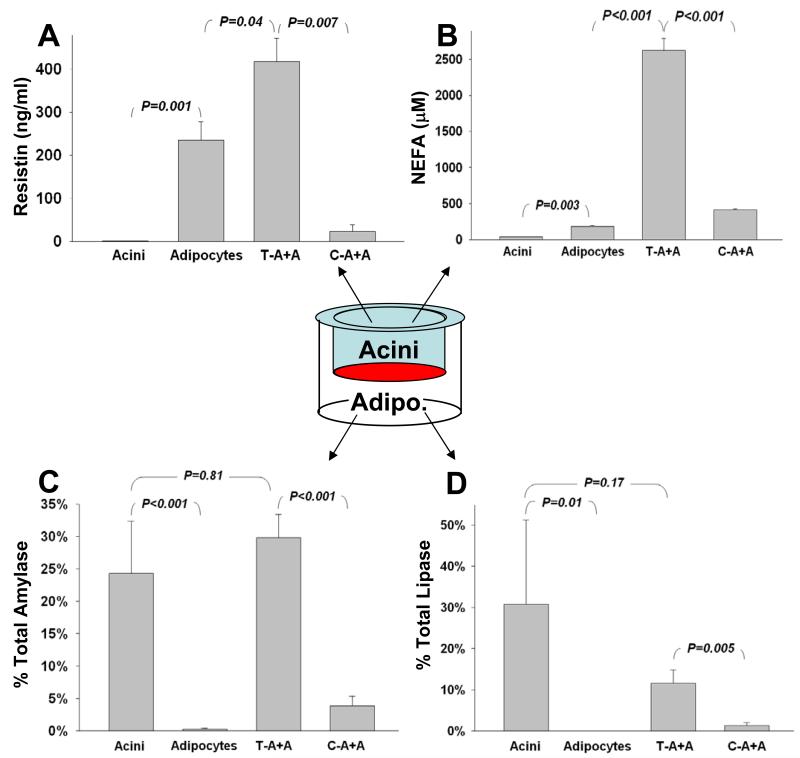
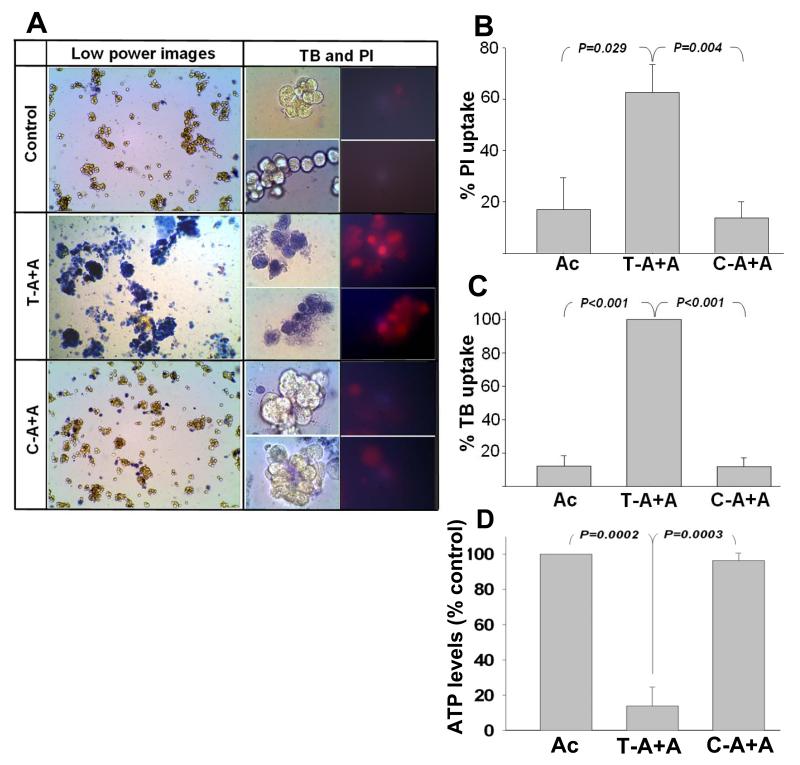
Results: Levels of IPF were significantly higher in nonobese patients with CP than in nonobese controls. In patients with CP or AP-on-CP, areas of IPF were surrounded by significantly more fibrosis than in controls or patients with AP. Fat necrosis-associated peri-fat acinar necrosis (PFAN, indicated by NEFA spillage) contributed to most of the necrosis observed in samples from patients with AP; however, findings of peri-fat acinar necrosis and total necrosis were significantly lower in samples from patients with CP or AP-on-CP. Fibrosis appeared to wall off the fat necrosis and limit peri-fat acinar necrosis, reducing acinar necrosis. In vitro, collagen I limited the lipolytic flux between acinar cells and adipocytes and prevented increases in adipokines in the acinar compartment. This was associated with reduced acinar cell necrosis. However, NEFAs, but not adipokines, caused acinar cell necrosis.
Conclusions: Based on analysis of pancreatic samples from patients with CP, AP, or AP-on-CP and in vitro studies, fibrosis reduces the severity of acute exacerbations of CP by reducing lipolytic flux between adipocytes and acinar cells.
Keywords: AP; ATP; BMI; CP; CT; FN; IPF; Inflammation; Mechanism; NEFA; Necrosis; PFAN; PI; Pancreas; SAP; UFA; acute pancreatitis; adenosine triphosphate; body mass index; chronic pancreatitis; computed tomography; fat necrosis; intrapancreatic fat; nonesterified fatty acid; peri-fat acinar necrosis; propidium iodide; severe acute pancreatitis; unsaturated fatty acid.
Copyright © 2013 AGA Institute. Published by Elsevier Inc. All rights reserved.
Figures
Similar articles
-
Peripancreatic fat necrosis worsens acute pancreatitis independent of pancreatic necrosis via unsaturated fatty acids increased in human pancreatic necrosis collections.Gut. 2016 Jan;65(1):100-11. doi: 10.1136/gutjnl-2014-308043. Epub 2014 Dec 10. Gut. 2016. PMID: 25500204 Free PMC article.
-
Low serum trypsinogen levels in chronic pancreatitis: Correlation with parenchymal loss, exocrine pancreatic insufficiency, and diabetes but not CT-based cambridge severity scores for fibrosis.Pancreatology. 2020 Oct;20(7):1368-1378. doi: 10.1016/j.pan.2020.08.025. Epub 2020 Sep 5. Pancreatology. 2020. PMID: 32967795
-
Adipose Stem Cell Therapy Mitigates Chronic Pancreatitis via Differentiation into Acinar-like Cells in Mice.Mol Ther. 2017 Nov 1;25(11):2490-2501. doi: 10.1016/j.ymthe.2017.06.016. Epub 2017 Aug 4. Mol Ther. 2017. PMID: 28784560 Free PMC article.
-
Role of pancreatic fat in the outcomes of pancreatitis.Pancreatology. 2014 Sep-Oct;14(5):403-8. doi: 10.1016/j.pan.2014.06.004. Epub 2014 Jul 1. Pancreatology. 2014. PMID: 25278311 Free PMC article. Review.
-
Value of adipokines in predicting the severity of acute pancreatitis: comprehensive review.World J Gastroenterol. 2012 Dec 7;18(45):6620-7. doi: 10.3748/wjg.v18.i45.6620. World J Gastroenterol. 2012. PMID: 23236237 Free PMC article. Review.
Cited by
-
Pediatric Pancreatitis: Outcomes and Current Understanding.J Indian Assoc Pediatr Surg. 2020 Jan-Feb;25(1):22-27. doi: 10.4103/jiaps.JIAPS_223_18. Epub 2019 Nov 27. J Indian Assoc Pediatr Surg. 2020. PMID: 31896895 Free PMC article.
-
Potential influence of intravenous lipids on the outcomes of acute pancreatitis.Nutr Clin Pract. 2014 Jun;29(3):291-4. doi: 10.1177/0884533614527774. Epub 2014 Mar 31. Nutr Clin Pract. 2014. PMID: 24687866 Free PMC article.
-
Peripancreatic fat necrosis worsens acute pancreatitis independent of pancreatic necrosis via unsaturated fatty acids increased in human pancreatic necrosis collections.Gut. 2016 Jan;65(1):100-11. doi: 10.1136/gutjnl-2014-308043. Epub 2014 Dec 10. Gut. 2016. PMID: 25500204 Free PMC article.
-
Excess Body Weight and Pancreatic Disease.Visc Med. 2021 Aug;37(4):281-286. doi: 10.1159/000517147. Epub 2021 Jul 9. Visc Med. 2021. PMID: 34540944 Free PMC article. Review.
-
Visceral fat lipolysis by pancreatic lipases worsens heart failure.Cell Rep Med. 2025 Jun 17;6(6):102147. doi: 10.1016/j.xcrm.2025.102147. Epub 2025 Jun 2. Cell Rep Med. 2025. PMID: 40460832 Free PMC article.
References
-
- Papachristou GI, Papachristou DJ, Avula H, Slivka A, Whitcomb DC. Obesity increases the severity of acute pancreatitis: performance of APACHE-O score and correlation with the inflammatory response. Pancreatology. 2006;6:279–85. - PubMed
-
- Porter KA, Banks PA. Obesity as a predictor of severity in acute pancreatitis. Int J Pancreatol. 1991;10:247–52. - PubMed
-
- Sempere L, Martinez J, de Madaria E, Lozano B, Sanchez-Paya J, Jover R, Perez-Mateo M. Obesity and fat distribution imply a greater systemic inflammatory response and a worse prognosis in acute pancreatitis. Pancreatology. 2008;8:257–64. - PubMed
-
- Navina S, Acharya C, DeLany JP, Orlichenko LS, Baty CJ, Shiva SS, Durgampudi C, Karlsson JM, Lee K, Bae KT, Furlan A, Behari J, Liu S, McHale T, Nichols L, Papachristou GI, Yadav D, Singh VP. Lipotoxicity causes multisystem organ failure and exacerbates acute pancreatitis in obesity. Sci Transl Med. 2011;3:107ra110. - PMC - PubMed
-
- Funnell IC, Bornman PC, Weakley SP, Terblanche J, Marks IN. Obesity: an important prognostic factor in acute pancreatitis. Br J Surg. 1993;80:484–6. - PubMed
Publication types
MeSH terms
Substances
Grants and funding
LinkOut - more resources
Full Text Sources
Other Literature Sources
Medical
Research Materials
Miscellaneous
