. 2013 Jul-Aug:38:79-91.
doi: 10.1016/j.ntt.2013.05.002. Epub 2013 May 15.

Dietary and genetic manipulations of folate metabolism differentially affect neocortical functions in mice

Affiliations

Dietary and genetic manipulations of folate metabolism differentially affect neocortical functions in mice

J A Ash et al. Neurotoxicol Teratol. 2013 Jul-Aug.

Abstract

Converging evidence suggests that folate-mediated one-carbon metabolism may modulate cognitive functioning throughout the lifespan, but few studies have directly tested this hypothesis. This study examined the separate and combined effects of dietary and genetic manipulations of folate metabolism on neocortical functions in mice, modeling a common genetic variant in the MTHFD1 gene in humans. Mutant (Mthfd1(gt/+)) and wildtype (WT) male mice were assigned to a folate sufficient or deficient diet at weaning and continued on these diets throughout testing on a series of visual attention tasks adapted from the 5-choice serial reaction time task. WT mice on a deficient diet exhibited impulsive responding immediately following a change in task parameters that increased demands on attention and impulse control, and on trials following an error. This pattern of findings indicates a heightened affective response to stress and/or an inability to regulate negative emotions. In contrast, Mthfd1(gt/+) mice (regardless of diet) exhibited attentional dysfunction and a blunted affective response to committing an error. The Mthfd1(gt/+) mice also showed significantly decreased expression levels for genes encoding choline dehydrogenase and the alpha 7 nicotinic cholinergic receptor. The effects of the MTHFD1 mutation were less pronounced when combined with a deficient diet, suggesting a compensatory mechanism to the combined genetic and dietary perturbation of folate metabolism. These data demonstrate that common alterations in folate metabolism can produce functionally distinct cognitive and affective changes, and highlight the importance of considering genotype when making dietary folate recommendations.

Keywords: Affect; Attention; Folate; Impulsivity; MTHFD1.


Conflict of interest statement

statement There are no conflicts of interest to report.

Figures

Fig. 1
Fig. 1
Task 3 (pre-cue delay: 0, 2, 4 s; cue duration: 1 s) performance: (A) Percentage of correct responses averaged across all conditions; the significant Genotype × Diet interaction indicates that the Def diet tended to impair performance of the WT mice but improve performance of the gt/+ mice; (B) percentage of correct responses as a function of session-block; the gt/+ mice performed significantly better than the WT mice early in testing (block 2: gt/+ > WT, p = 0.013); (C) percentage of premature responses as a function of session-block, revealing effects of both Diet and Genotype during session-block 2: (1) a higher percentage of premature responses for the mice maintained on the Def diet (relative to those on the Suf diet) for trials with either a 2 s (p = 0.014) or 4 s delay (p = 0.017), and (2) a higher percentage of premature responses for the WT mice than the gt/+ mice (p = 0.025); and (D) percentage of omission errors averaged across all conditions, showing that the gt/+ Suf mice make a significantly higher percentage of omission errors than gt/+ Def mice (p = 0.008). Abbreviations: WT Suf: wildtype mice fed a folate sufficient diet; WT Def: wildtype mice fed a folate deficient diet; gt/+ Suf: Mthfd1gt/+ mice fed a folate sufficient diet; gt/+ Def: Mthfd1gt/+ mice fed a folate deficient diet; gt/+: Mthfd1gt/+ mice, WT: wildtype mice; *indicates significance ≤ 0.05. Data points are means ± SEM.
Fig. 2
Fig. 2
Task 4 (pre-cue delay: 0, 2, 4 s; cue duration: 0.8, 1.0, 1.4 s) performance as a function of the outcome of the prior trial (Prev) i.e., correct or incorrect: (A) Percentage of correct responses as a function of pre-cue delay and Prev; no group differences were seen for trials following a correct response whereas for trials following an error and including a pre-cue delay, the gt/+ mice performed significantly better than the WT mice (2 s delay: WT < gt/+, p = 0.030; 4 s delay: WT < gt/+, p = 0001); (B) percentage of correct responses as a function of cue duration and Prev, showing that the WT Def mice performed more poorly than WT Suf specifically on trials that both followed an error and included the briefest cue (p = 0.0079); (C) percentage of premature responses as a function of pre-cue delay and Prev; the WT mice made a significantly higher percentage of premature responses than the gt/+ mice on trials that both followed an error and included the longest delay (p = 0.004), although this effect appears driven by the WT Def mice; and (D) percentage of omission errors as a function of Prev (averaged across all other conditions), indicating that the percentage of omission errors was significantly higher for the WT mice than the gt/+ mice specifically on trials that followed an error (p = 0.0005). Abbreviations: WT Suf: wildtype mice fed a folate sufficient diet; WT Def: wildtype mice fed a folate deficient diet; gt/+Suf: Mthfd1gt/+ mice fed a folate sufficient diet; gt/+ Def: Mthfd1gt/+ mice fed a folate deficient diet; gt/+: Mthfd1gt/+ mice, WT: wildtype mice; *indicates significance ≤ 0.05. Data points are means ± SEM.
Fig. 3
Fig. 3
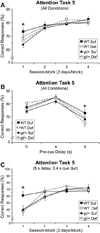
Task 5 (pre-cue delay: 0, 4, 8 s; cue duration: 0.4, 0.8, 1.2 s) percentage of correct responses: (A) Percentage of correct responses as a function of session block; the performance of the gt/+ Suf mice was significantly lower than that of the WT Suf mice in session-block 1 (p = 0.032); (B) percentage of correct responses as a function of pre-cue delay; the WT Def mice performed significantly more poorly than WT Suf mice for trials with the longest pre-delay (8 s delay: WT Def < WT Suf, p = 0.038); and (C) percentage correct for the most demanding condition (trials with an 8 s pre-cue delay and 0.4 s cue duration), as a function of session-block; all groups performed significantly more poorly than the WT Suf group in the first block of testing (WT Suf > WT Def, p = 0.011; WT Suf > gt/+ Def, p = 0.015; WT Suf > gt/+ Suf, p = 0.018). Abbreviations: WT Suf: wildtype mice fed a folate sufficient diet; WT Def: wildtype mice fed a folate deficient diet; gt/+ Suf: Mthfd1gt/+ mice fed a folate sufficient diet; gt/+ Def: Mthfd1gt/+ mice fed a folate deficient diet; gt/+: Mthfd1gt/+ mice, WT: wildtype mice; *indicates significance ≤ 0.05. Data points are means ± SEM.
Fig. 4
Fig. 4
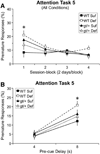
Task 5 (pre-cue delay: 0, 4, 8 s; cue duration: 0.4, 0.8, 1.2 s) percentage of premature responses: (A) Percentage of premature responses as a function of session-block, revealing that the WT Def (p = 0.001) and gt/+ Suf (p = 0.050) groups committed a significantly higher percentage of premature responses than the WT Suf group in session-block 1; and (B) percent premature responses as a function of pre-cue delay; for trials with an 8 s pre-cue delay, the WT Def mice committed a significantly higher percentage of premature responses than WT Suf mice (p = 0.007). Abbreviations: WT Suf: wildtype mice fed a folate sufficient diet; WT Def: wildtype mice fed a folate deficient diet; gt/+ Suf: Mthfd1gt/+ mice fed a folate sufficient diet; gt/+ Def: Mthfd1gt/+ mice fed a folate deficient diet; *indicates significance ≤ 0.05. Data points are means ± SEM.
Fig. 5
Fig. 5
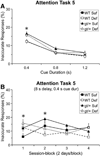
Task 5 (pre-cue delay: 0, 4, 8 s; cue duration: 0.4, 0.8, 1.2 s) percentage of inaccurate responses: (A) Percentage of inaccurate responses as a function of cue duration; the gt/+ mice made a significantly higher percentage of inaccurate responses than the WT mice specifically for trials with the briefest cue (p = 0.0002); and (B) percentage of inaccurate responses for the most demanding trials (8 s delay, 0.4 s cue duration), as a function of session-block, revealing a significantly higher percentage of inaccurate responses for mice on the Def diet relative to the Suf diet in session-block 1 (p = 0.041), whereas this pattern was reversed in session-block 2 (p = 0.006), before the groups converged in session-blocks 3 and 4. Abbreviations: WT Suf: wildtype mice fed a folate sufficient diet; WT Def: wildtype mice fed a folate deficient diet; gt/+ Suf: Mthfd1gt/+ mice fed a folate sufficient diet; gt/+ Def: Mthfd1gt/+ mice fed a folate deficient diet; gt/+: Mthfd1gt/+ mice, WT: wildtype mice; Def: folate deficient diet, Suf: folate sufficient diet; *indicates significance ≤ 0.05. Data points are means ± SEM.
Fig. 6
Fig. 6
Dot plots for red blood cell (RBC) folate levels and cholinergic gene expression data: (A) RBC folate levels normalized to total protein levels, indicating that mice on the Def diet had significantly lower RBC levels than those on the Suf diet (p = 0.0009); (B) fold change in nAChR7 expression levels relative to GAPDH expression, showing significantly reduced nAChR7 expression for the gt/+ mice relative to the WT mice (p = 0.027), although this effect was less pronounced for the gt/+ Def mice; (C) fold change in CHT1 expression levels relative to GAPDH expression, indicating significantly higher expression for mice maintained on the Def diet (Def > Suf, p = 0.040); and (D) fold change in CHDH expression levels relative to GAPDH expression, revealing significantly reduced expression for the gt/+ mice (gt/+ < WT, p = 0.011). Abbreviations: WT Suf: wildtype mice fed a folate sufficient diet; WT Def: wildtype mice fed a folate deficient diet; gt/+ Suf: Mthfd1gt/+ mice fed a folate sufficient diet; gt/+ Def: Mthfd1gt/+ mice fed a folate deficient diet; gt/+: Mthfd1gt/+ mice; WT: wildtype mice; CHDH: choline dehydrogenase, nAChR7: nicotinic acetylcholine receptor alpha 7; CHT1: high affinity choline transporter; GAPDH: glyceraldehyde-3-phosphate dehydrogenase.

Similar articles

Cited by

References

    1. Alpert JE, Mischoulon D, Rubenstein GE, Bottonari K, Nierenberg AA, Fava M. Folinic acid (leucovorin) as an adjunctive treatment for SSRI-refractory depression. Ann Clin Psychiatry. 2002;14:33–38. - PubMed
    1. Ariogul S, Cankurtaran M, Dagli N, Khalil M, Yavuz B. Vitamin B12, folate, homocysteine and dementia: are they really related? Arch Gerontol Geriatr. 2005;40:139–146. - PubMed
    1. Arnsten AF, Li BM. Neurobiology of executive functions: catecholamine influences on prefrontal cortical functions. Biol Psychiatry. 2005;57:1377–1384. - PubMed
    1. Bachevalier J, Botez MI. Avoidance behavior in folate-deficient rats. Tohoku J Exp Med. 1978;126:111–116. - PubMed
    1. Bachevalier J, Joyal C, Botez MI. Blood thiamine and blood folate levels. A comparative study in control, alcoholic and folate-deficient subjects. Int J Vitam Nutr Res. 1981;51:205–210. - PubMed

Publication types

Substances