. 2013 Oct 15:80:169-89.
doi: 10.1016/j.neuroimage.2013.05.033. Epub 2013 May 16.

Function in the human connectome: task-fMRI and individual differences in behavior

Affiliations

Function in the human connectome: task-fMRI and individual differences in behavior

Deanna M Barch et al. Neuroimage. .

Abstract

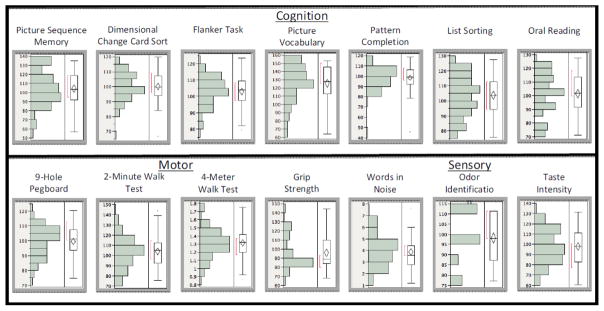
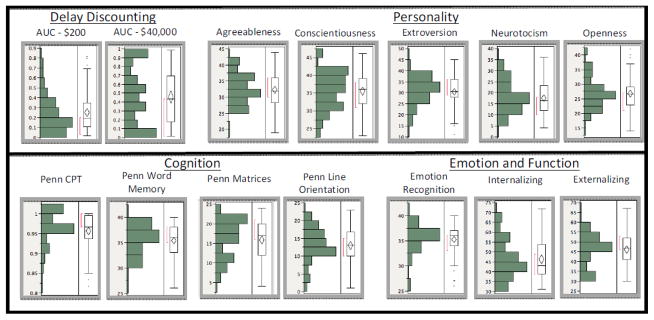
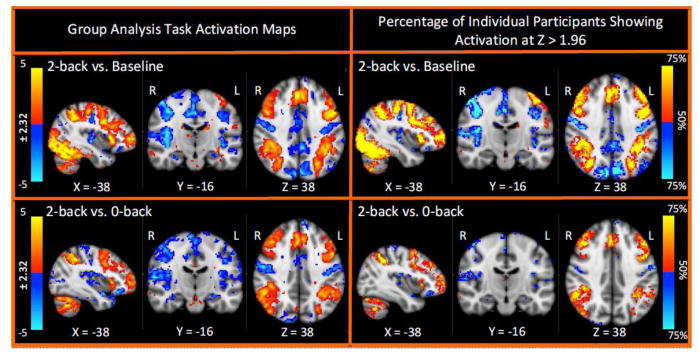
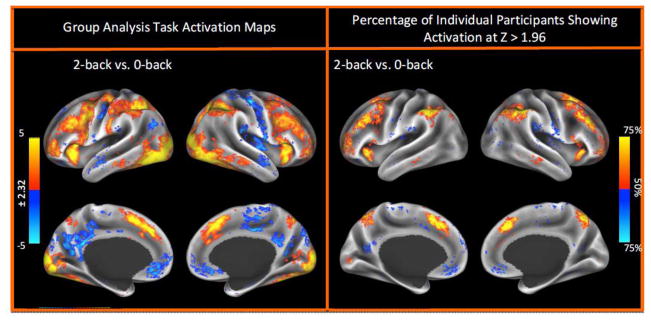
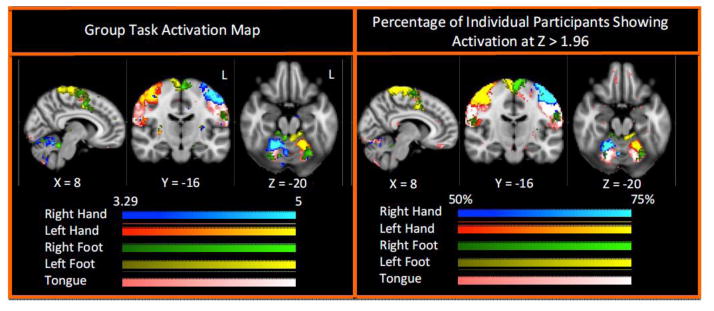
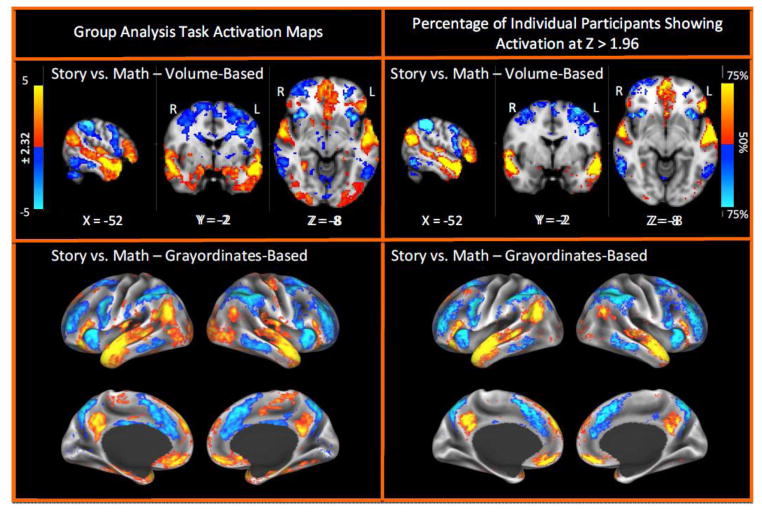
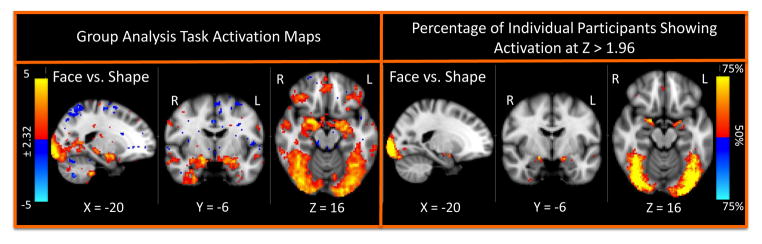
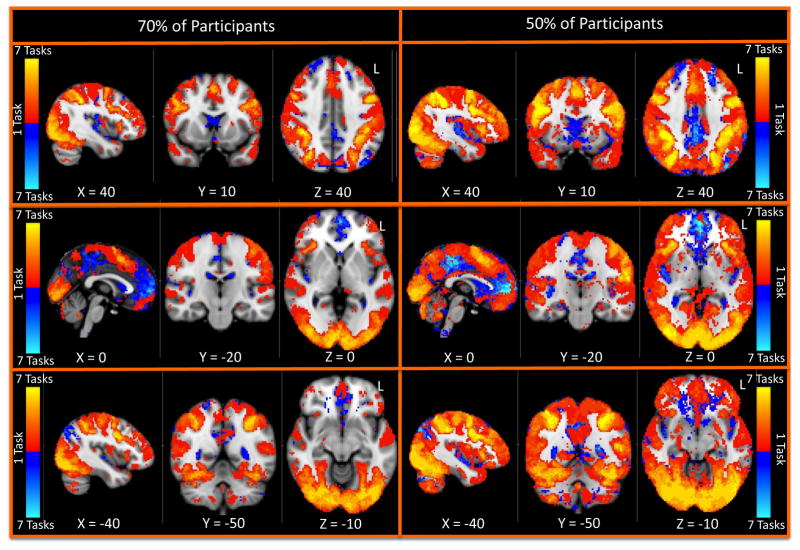
The primary goal of the Human Connectome Project (HCP) is to delineate the typical patterns of structural and functional connectivity in the healthy adult human brain. However, we know that there are important individual differences in such patterns of connectivity, with evidence that this variability is associated with alterations in important cognitive and behavioral variables that affect real world function. The HCP data will be a critical stepping-off point for future studies that will examine how variation in human structural and functional connectivity play a role in adult and pediatric neurological and psychiatric disorders that account for a huge amount of public health resources. Thus, the HCP is collecting behavioral measures of a range of motor, sensory, cognitive and emotional processes that will delineate a core set of functions relevant to understanding the relationship between brain connectivity and human behavior. In addition, the HCP is using task-fMRI (tfMRI) to help delineate the relationships between individual differences in the neurobiological substrates of mental processing and both functional and structural connectivity, as well as to help characterize and validate the connectivity analyses to be conducted on the structural and functional connectivity data. This paper describes the logic and rationale behind the development of the behavioral, individual difference, and tfMRI batteries and provides preliminary data on the patterns of activation associated with each of the fMRI tasks, at both group and individual levels.

Keywords: Cognitive; Connectivity; Emotion; Individual differences; Personality; Sensory and motor function; Task-fMRI.


Figures

Figure 1
Figure 1. Toolbox Measures
Distribution of Scores for NIH Toolbox Measures. Boxplots showing the data from the 77 participants that constitute the first quarterly release of data for the Human Connectome Project. The ends of the box represent the 25th and 75th quantiles. The vertical line within the box represents the median value, and the diamond within the box illustrates the mean and the upper and lower 95% confidence intervals around the mean. The lines extending from the box are called whiskers and represented 1.5 X the interquartile range (the difference between he first and the third quartiles) in either direction. The red bracket next the box illustrates the densest 50% of the observations (called the shortest half).
Figure 2
Figure 2. Non-Toolbox Measures
Distribution of Scores for Non-Toolbox Measures. See Figure 1 caption.
Figure 3
Figure 3. Working Memory/Cognitive Control (N-back Task)
Group and Activation Count Maps for the Working Memory Task.
Figure 4
Figure 4. Working Memory/Cognitive Control (N-back Task); Grayordinates-Based Analysis
Group and Activation Count Maps for the Working Memory Task from the Grayordinates-Based Analysis.
Figure 5
Figure 5. Category Specific Stimulus Representations (Embedded in N-back Task)
Group and Activation Count Maps for the Category Specific Representation Contrasts.
Figure 6
Figure 6. Incentive Processing (Gambling Task)
Group and Activation Count Maps for the Incentive Processing Task.
Figure 7
Figure 7. Motor Mapping Task
Group and Activation Count Maps for the Motor Mapping Task.
Figure 8
Figure 8. Language Processing (Story Task)
Group and Activation Count Maps for the Language Processing Task. The upper two panels show the results from the volume-based processing stream and the bottom two panels show the results from the grayordinates-based processing stream.
Figure 9
Figure 9. Social Cognition (Theory of Mind Task)
Group and Activation Count Maps for the Social Cognition Task.
Figure 10
Figure 10. Relational Processing (Dimensional Change Detection Task)
Group and Activation Count Maps for the Relational Processing Task.
Figure 11
Figure 11. Emotional Processing (“Hariri Task”)
Group and Activation Count Maps for the Emotional Processing Task.
Figure 12
Figure 12. Aggregate Brain Coverage from Volume-Based Analysis
Task Count Maps from Volume-Based Analysis. These figures illustrate the number of tasks, for each voxel, that show activation at Z>1.96 in at least 70% and 50% of participants at the individual subject analysis level.
Figure 13
Figure 13. Aggregate Brain Coverage form Grayordinates-Based Analysis
Figure 13. Task Count Maps from Grayordinates-Based Analysis. These figures illustrate the number of tasks, for each voxel, that show activation at Z>1.96 in at least 70% and 50% of participants at the individual subject analysis level.

Similar articles

Cited by

References

    1. Achenbach TM. The Achenbach System of Empirically Based Assessment (ASEBA): Development, findings, theory and applications. University of Vermont Research Center for Children, Youth and Families; Burlington, VT: 2009.
    1. Antal A, Baudewig J, Paulus W, Dechent P. The posterior cingulate cortex and planum temporale/parietal operculum are activated by coherent visual motion. Visual neuroscience. 2008;25:17–26. - PubMed
    1. Anticevic A, Dierker DL, Gillespie SK, Repovs G, Csernansky JG, Van Essen DC, Barch DM. Comparing surface-based and volume-based analyses of functional neuroimaging data in patients with schizophrenia. Neuroimage. 2008;41:835–848. - PMC - PubMed
    1. Arditi A. Improving the design of the letter contrast sensitivity test. Invest Ophthalmol Vis Sci. 2005;46:2225–2229. - PubMed
    1. Bassett DS, Bullmore ET, Meyer-Lindenberg A, Apud JA, Weinberger DR, Coppola R. Cognitive fitness of cost-efficient brain functional networks. Proc Natl Acad Sci U S A. 2009;106:11747–11752. - PMC - PubMed