

Visual callosal topography in the absence of retinal input
- PMID: 23684881
- PMCID: PMC3742332
- DOI: 10.1016/j.neuroimage.2013.05.038
Visual callosal topography in the absence of retinal input
Abstract
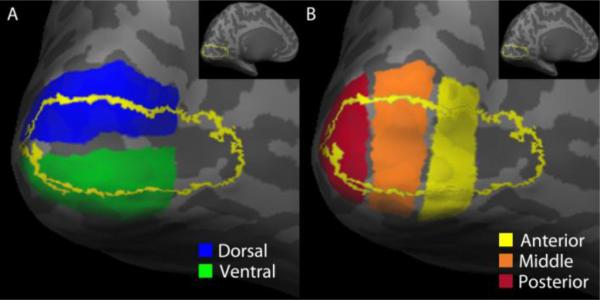
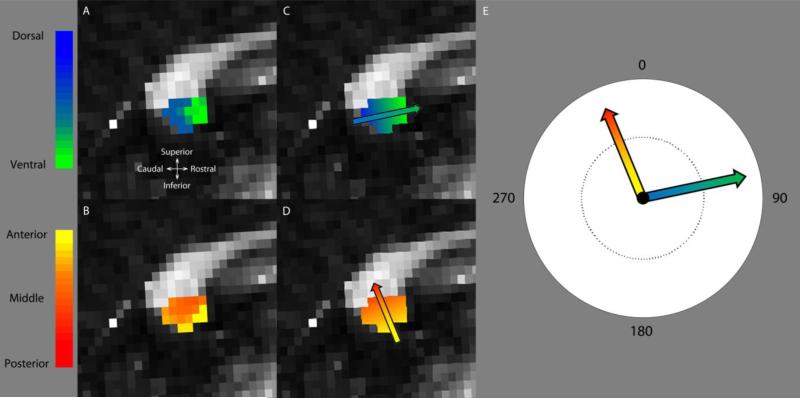
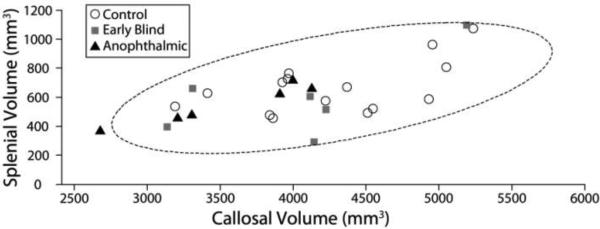
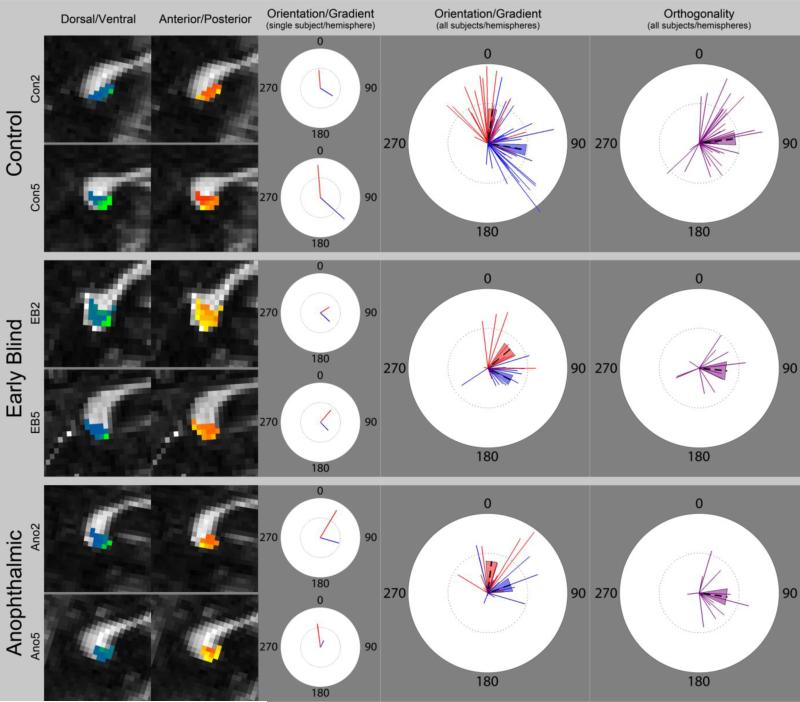
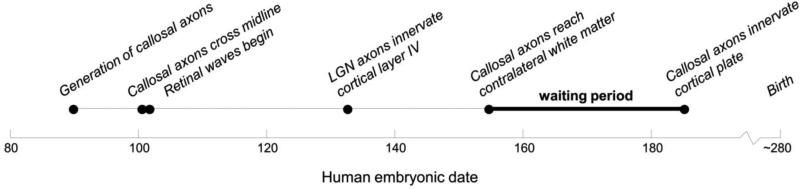
Using probabilistic diffusion tractography, we examined the retinotopic organization of splenial callosal connections within early blind, anophthalmic, and control subjects. Early blind subjects experienced prenatal retinal "waves" of spontaneous activity similar to those of sighted subjects, and only lack postnatal visual experience. In anophthalmia, the eye is either absent or arrested at an early prenatal stage, depriving these subjects of both pre- and postnatal visual input. Therefore, comparing these two groups provides a way of separating the influence of pre- and postnatal retinal input on the organization of visual connections across hemispheres. We found that retinotopic mapping within the splenium was not measurably disrupted in early blind or anophthalmic subjects compared to visually normal controls. No significant differences in splenial volume were observed across groups. No significant differences in diffusivity were found between early blind subjects and sighted controls, though some differences in diffusivity were noted between anophthalmic subjects and controls. These results suggest that neither prenatal retinal activity nor postnatal visual experience plays a role in the large-scale topographic organization of visual callosal connections within the splenium.
Keywords: Anophthalmia; Blind; Development; Diffusion tensor imaging; Plasticity; Tractography.
Copyright © 2013 Elsevier Inc. All rights reserved.
Figures
Similar articles
-
In vivo evaluation of retinal and callosal projections in early postnatal development and plasticity using manganese-enhanced MRI and diffusion tensor imaging.Neuroimage. 2012 Feb 1;59(3):2274-83. doi: 10.1016/j.neuroimage.2011.09.055. Epub 2011 Oct 1. Neuroimage. 2012. PMID: 21985904
-
A comparison of visual callosal organization in normal, bilaterally enucleated and congenitally anophthalmic mice.Exp Brain Res. 1984;56(1):92-105. doi: 10.1007/BF00237445. Exp Brain Res. 1984. PMID: 6468571
-
Imaging studies in congenital anophthalmia reveal preservation of brain architecture in 'visual' cortex.Brain. 2009 Dec;132(Pt 12):3467-80. doi: 10.1093/brain/awp279. Brain. 2009. PMID: 19892766
-
Deafferentation-induced plasticity of visual callosal connections: predicting critical periods and analyzing cortical abnormalities using diffusion tensor imaging.Neural Plast. 2012;2012:250196. doi: 10.1155/2012/250196. Epub 2012 Nov 8. Neural Plast. 2012. PMID: 23213572 Free PMC article. Review.
-
Visual interhemispheric communication and callosal connections of the occipital lobes.Cortex. 2014 Jul;56:1-13. doi: 10.1016/j.cortex.2013.02.001. Epub 2013 Feb 13. Cortex. 2014. PMID: 23489777 Review.
Cited by
-
Peripheral sounds elicit stronger activity in contralateral occipital cortex in blind than sighted individuals.Sci Rep. 2019 Aug 12;9(1):11637. doi: 10.1038/s41598-019-48079-3. Sci Rep. 2019. PMID: 31406158 Free PMC article.
-
The Effect of Congenital and Acquired Bilateral Anophthalmia on Brain Structure.Neuroophthalmology. 2021 Mar 1;45(2):75-86. doi: 10.1080/01658107.2020.1856143. eCollection 2021. Neuroophthalmology. 2021. PMID: 34108778 Free PMC article.
-
Functional connectivity of visual cortex in the blind follows retinotopic organization principles.Brain. 2015 Jun;138(Pt 6):1679-95. doi: 10.1093/brain/awv083. Epub 2015 Apr 13. Brain. 2015. PMID: 25869851 Free PMC article.
-
Patterns of Individual Variation in Visual Pathway Structure and Function in the Sighted and Blind.PLoS One. 2016 Nov 3;11(11):e0164677. doi: 10.1371/journal.pone.0164677. eCollection 2016. PLoS One. 2016. PMID: 27812129 Free PMC article.
-
Morphometric changes of the corpus callosum in congenital blindness.PLoS One. 2014 Sep 25;9(9):e107871. doi: 10.1371/journal.pone.0107871. eCollection 2014. PLoS One. 2014. PMID: 25255324 Free PMC article.
References
-
- Aggoun-Zouaoui D, Innocenti GM. Juvenile Visual Callosal Axons in Kittens Display Origin-Related and Fate-Related Morphology and Distribution of Arbors. European Journal of Neuroscience. 1994;6:1846–1863. - PubMed
-
- Ashburner J, Friston KJ. Why voxel-based morphometry should be used. Neuroimage. 2001;14:1238–1243. - PubMed
-
- Behrens TE, Woolrich MW, Jenkinson M, Johansen-Berg H, Nunes RG, Clare S, Matthews PM, Brady JM, Smith SM. Characterization and propagation of uncertainty in diffusion-weighted MR imaging. Magn Reson Med. 2003a;50:1077–1088. - PubMed
Publication types
MeSH terms
Grants and funding
LinkOut - more resources
Full Text Sources
Other Literature Sources
