. 2013 Sep 5:247:35-42.
doi: 10.1016/j.neuroscience.2013.05.013. Epub 2013 May 16.

Sleep active cortical neurons expressing neuronal nitric oxide synthase are active after both acute sleep deprivation and chronic sleep restriction

Affiliations

Sleep active cortical neurons expressing neuronal nitric oxide synthase are active after both acute sleep deprivation and chronic sleep restriction

M R Zielinski et al. Neuroscience. .

Abstract

Non-rapid eye movement (NREM) sleep electroencephalographic (EEG) delta power (~0.5-4 Hz), also known as slow wave activity (SWA), is typically enhanced after acute sleep deprivation (SD) but not after chronic sleep restriction (CSR). Recently, sleep-active cortical neurons expressing neuronal nitric oxide synthase (nNOS) were identified and associated with enhanced SWA after short acute bouts of SD (i.e., 6h). However, the relationship between cortical nNOS neuronal activity and SWA during CSR is unknown. We compared the activity of cortical neurons expressing nNOS (via c-Fos and nNOS immuno-reactivity, respectively) and sleep in rats in three conditions: (1) after 18-h of acute SD; (2) after five consecutive days of sleep restriction (SR) (18-h SD per day with 6h ad libitum sleep opportunity per day); (3) and time-of-day matched ad libitum sleep controls. Cortical nNOS neuronal activity was enhanced during sleep after both 18-h SD and 5 days of SR treatments compared to control treatments. SWA and NREM sleep delta energy (the product of NREM sleep duration and SWA) were positively correlated with enhanced cortical nNOS neuronal activity after 18-h SD but not 5days of SR. That neurons expressing nNOS were active after longer amounts of acute SD (18h vs. 6h reported in the literature) and were correlated with SWA further suggest that these cells might regulate SWA. However, since these neurons were active after CSR when SWA was not enhanced, these findings suggest that mechanisms downstream of their activation are altered during CSR.

Keywords: ANOVA; CSR; EEG; EMG; NREM; PBS; REM; SD; SR; SWA; ZT; analysis of variance; c-Fos; chronic sleep restriction; electroencephalogram; electromyogram; nNOS; neuronal nitric oxide synthase; non-rapid eye movement; phosphate-buffered saline; rapid eye movement; sleep deprivation; sleep restriction; slow wave activity; zeitgeber time.


Figures

Fig. 1
Fig. 1
Representative immunohistochemically stained section of c-Fos positive and nNOS positive cells in the parietal cortex (10 × objective). The insert shows c-Fos positive nNOS cells at a higher magnification (40 × objective). c-Fos positive cells are stained black and nNOS positive cells are stained red. Black arrows = c-Fos and nNOS double positive cells. White arrows = nNOS positive and c-Fos negative cells.
Fig. 2
Fig. 2
Percentage of cortical c-Fos positive cells per total nNOS positive cells after the first 3 h (ZT 0-3 h) of the sleep opportunity after sleep loss treatments. Rats that underwent 18 h SD had enhanced percentages of activated nNOS cells in the cerebral cortex compared to time-of-day matched baseline sleep control rats. The percentage of activated nNOS cells in the cerebral cortex were similarly enhanced in rats after CSR compared to baseline control rats. * = significant difference between treatment groups. Significance was set at p < 0.05.
Fig. 3
Fig. 3
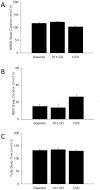
NREM sleep, REM sleep, total sleep time (i.e., NREM sleep + REM sleep) durations during the first 3 h (ZT 0-3 h) of available sleep opportunities after sleep deprivation treatments. NREM sleep (A), REM sleep (B), and total sleep time (C) durations after 18 h SD and after CSR were not statistically different to time-of-day matched baseline sleep values.
Fig. 4
Fig. 4
SWA and NREM sleep delta energy responses normalized to spontaneous sleep measures during the dark period during sleep opportunities after sleep loss treatments. During the first 3 h (ZT 0-3 h) of available sleep opportunity after sleep loss treatments (ZT 6-24). SWA (A) and NREM sleep delta energy (C) values were significantly enhanced after 18 h SD compared to both time-of-day matched baseline control and CSR values. SWA and NREM sleep delta energy values after CSR were not significantly different from baseline control values. However, the enhanced SWA found after 18 h SD was found to occur mostly within the first hour (ZT 0-1) of available sleep opportunity (B). (*) = significant difference between treatment groups. Significance was set at p < 0.05.
Fig. 5
Fig. 5
NREM sleep EEG power (0.5-30 Hz range) responses during the first 3 h (ZT 0-3 h) of available sleep opportunity after sleep loss treatments (ZT 6-24) normalized as a percentage of spontaneous sleep during the dark period. NREM sleep EEG power (0.5-30 Hz range) was largely enhanced in rats after 18 h SD compared to rats that underwent baseline sleep (2.0-8.0, 9.0, and 17.0-23.0 Hz frequency ranges) or CSR (2.5-11.0 and 19.0-24.5 Hz frequency ranges). NREM sleep EEG power (0.5-30 Hz range) was not significantly different after CSR when compared to baseline sleep controls. (—) and (*) = significant difference between 18 h SD and baseline sleep control groups. (—) and (╪) = significant difference between 18 h SD and CSR treatment groups. Significance was set at p < 0.05.

Similar articles

Cited by

References

    1. Achermann P, Borbély AA. Mathematical models of sleep regulation. Front Biosci. 2003;8:S683–S693. - PubMed
    1. Baracchi F, Ingiosi AM, Raymond RM, Jr, Opp MR. Sepsis-induced alterations in sleep of rats. Am J Physiol Regul Integr Comp Physiol. 2011;301:R1467–R1478. - PMC - PubMed
    1. Barf RP, Meerlo P, Scheurink AJ. Chronic sleep disturbance impairs glucose homeostasis in rats. Int J Endocrinol. 2010;2010:819414. - PMC - PubMed
    1. Barf RP, Van Dijk G, Scheurink AJ, Hoffmann K, Novati A, Hulshof HJ, Fuchs E, Meerlo P. Metabolic consequences of chronic sleep restriction in rats: changes in body weight regulation and energy expenditure. Physiol Behav. 2012;107:322–328. - PubMed
    1. Borbély AA, Achermann P. Sleep homeostasis and models of sleep regulation. In: Kryger MH, Roth T, Dement WC, editors. Principles and Practice of Sleep Medicine. 4th. Elsevier Saunders; Philadelphia: 2005. pp. 405–417.

Publication types

Substances