. 2013 May 28;25(4):402-16.
doi: 10.1016/j.devcel.2013.04.011. Epub 2013 May 16.

MT1-MMP-dependent control of skeletal stem cell commitment via a β1-integrin/YAP/TAZ signaling axis

Affiliations

MT1-MMP-dependent control of skeletal stem cell commitment via a β1-integrin/YAP/TAZ signaling axis

Yi Tang et al. Dev Cell. .

Abstract

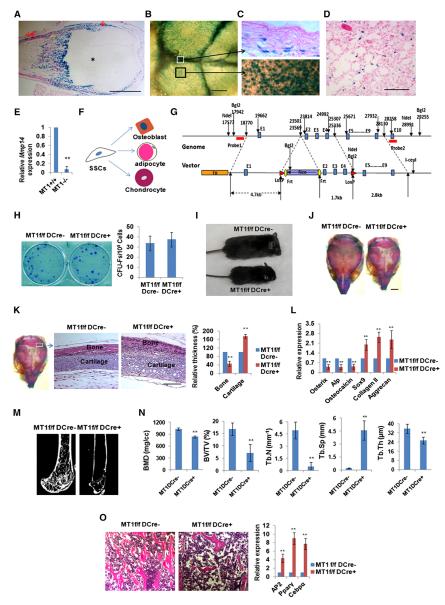
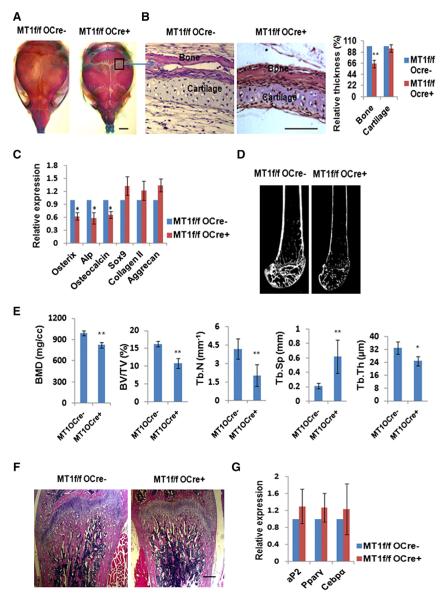
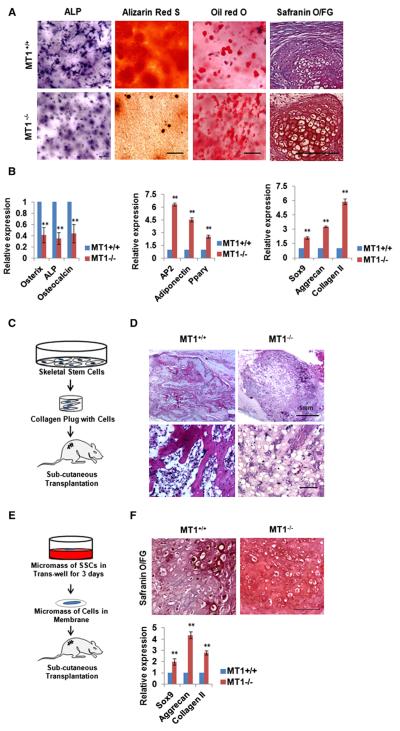
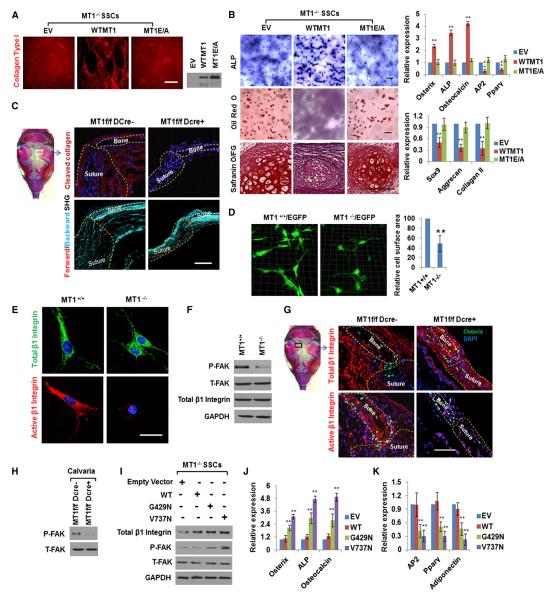
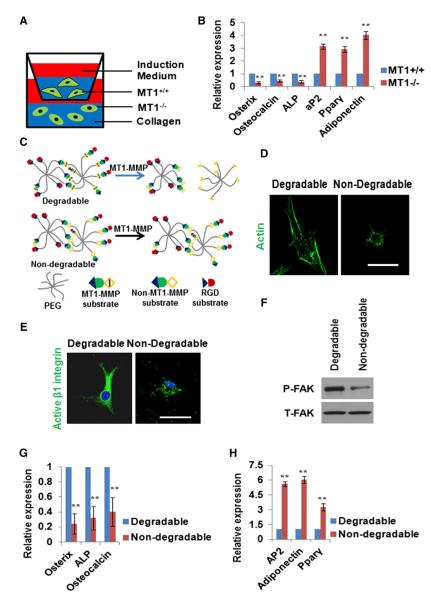
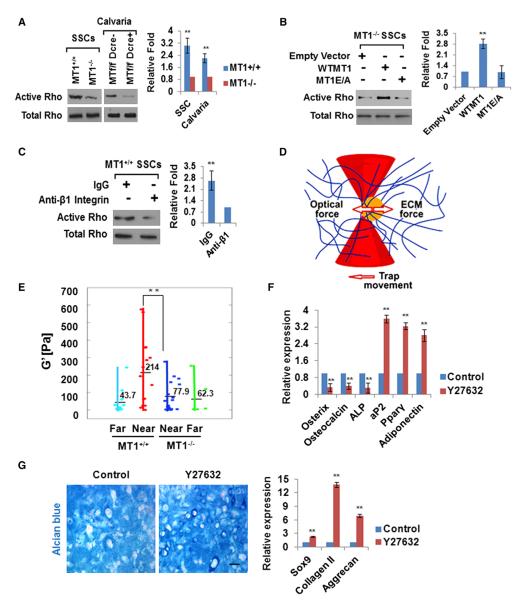
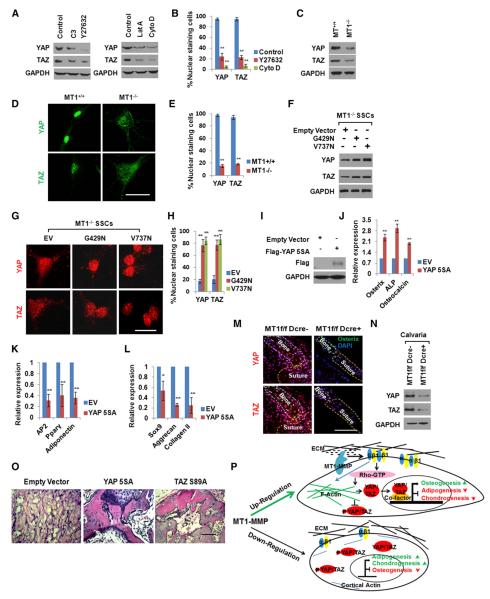
In vitro, topographical and biophysical cues arising from the extracellular matrix (ECM) direct skeletal stem cell (SSC) commitment and differentiation. However, the mechanisms by which the SSC-ECM interface is regulated and the outcome of such interactions on stem cell fate in vivo remain unknown. Here we demonstrate that conditional deletion of the membrane-anchored metalloproteinase MT1-MMP (Mmp14) in mesenchymal progenitors, but not in committed osteoblasts, redirects SSC fate decisions from osteogenesis to adipo- and chondrogenesis. By effecting ECM remodeling, MT1-MMP regulates stem cell shape, thereby activating a β1-integrin/RhoGTPase signaling cascade and triggering the nuclear localization of the transcriptional coactivators YAP and TAZ, which serve to control SSC lineage commitment. These data identify a critical MT1-MMP/integrin/YAP/TAZ axis operative in the stem cell niche that oversees SSC fate determination.


Figures

Figure 1
Figure 1. Expression and Genetic Inactivation of MT1-MMP in SSCs
(A) LacZ expression in perichondrium (↓), periosteum (↓↓), and bone (Δ), but not cartilage (*), in 7-day-old Mmp14+/LacZ mouse femur. The scale bar represents 1 mm. (B) LacZ expression in calvaria of a 10-day-old Mmp14+/LacZ mouse. The scale bar represents 500 μm. (C) LacZ expression in sagittal suture mesenchymal progenitors (upper panel, section from the white boxed region in B) versus LacZ expression in mesenchymal progenitors and osteoblasts residing on the calvarial surface in 10-day-old Mmp14+/LacZ mice (black boxed region in B is enlarged). The scale bar represents 100 μm. (D) LacZ expression in a subpopulation of bone-marrow cells in the femur of a 12-month-old Mmp14+/LacZ mouse. The scale bar represents 100 μm. (E) Real-time PCR of Mmp14 expression in SSCs from 14-day-old Mmp14+/+ and Mmp14−/− mice (n = 3). Data are presented as mean ± SEM. **p < 0.01, unpaired t test. (F) Schematic representation of the commitment of SSCs into three major lineages. (G) Schematic of the Mmp14 genomic locus and targeting construct. After homologous recombination, the FRT-flanked Neo was inserted into the intron between exons 1 and 2, and two LoxP sites were inserted into the introns between exons 1 and 2 and exons 4 and 5. (H) CFU-F generation from bone-marrow cells isolated from 4-week-old Mmp14f/f/Dermo1-Cre mice and control littermates (n = 6). Data are presented as mean ± SEM. Not significant, unpaired t test. (I) Gross view of a 14-day-old Mmp14f/f/Dermo1-Cre mouse and its control littermate (Mmp14f/f). (J) Alizarin red/Alcian blue staining of skulls isolated from 10-day-old Mmp14f/f and Mmp14f/f/Dermo1-Cre mice. The scale bar represents 2 mm. (K) Histology of newborn Mmp14f/f and Mmp14f/f/Dermo1-Cre skulls across the lambdoid suture area (boxed area sectioned and magnified in the two panels to the right). Relative bone and cartilage thickness are shown to the right (n = 5). The scale bar represents 100 μm. Data are presented as mean ± SEM. **p < 0.01, unpaired t test. (L) Relative mRNA expression of osteogenic and chondrogenic markers in newborn (1-day-old) calvarial RNA extracts from Mmp14f/f and Mmp14f/f/Dermo1-Cre mice (n = 6). Data are presented as mean ± SEM. **p < 0.01, unpaired t test. (M) Microcomputed tomography of the proximal femur of 12-week-old Mmp14f/f and Mmp14f/f/Dermo1-Cre mice. (N) Bone mineral density (BMD), bone volume/tissue volume (BV/TV), trabecular thickness (Tb.Th), trabecular number (Tb.N), and trabecular separation (Tb.Sp) measured by microcomputed tomography in 12-week-old Mmp14f/f and Mmp14f/f/Dermo1-Cre mice (n = 10). Data are presented as mean ± SEM. **p < 0.01, unpaired t test. (O) Histology of femur bone-marrow cavity and relative mRNA expression of adipogenic markers in bone-marrow RNA extracts from 12-week-old Mmp14f/f and Mmp14f/f/Dermo1-Cre mice (n = 6). The scale bar represents 100 μm. Data are presented as mean ± SEM. **p < 0.01, unpaired t test. See also Figure S1.
Figure 2
Figure 2. Osteopenia in Mice with Osteoblast Progenitor-Targeted Inactivation of MT1-MMP
(A) Alizarin red/Alcian blue staining of skulls isolated from 10-day-old Mmp14f/f and Mmp14f/f/Osterix-GFP-Cre mice. The scale bar represents 2 mm. (B) Histology of newborn Mmp14f/f and Mmp14f/f/Osterix-GFP-Cre mice skulls across the lambdoid suture area (boxed area in A, sectioned). Relative bone/cartilage thickness is shown to the right (n = 5). The scale bar represents 100 μm. Data are presented as mean ± SEM. **p < 0.01, unpaired t test. (C) Relative mRNA expression of osteogenic and chondrogenic markers in 1-day-old calvarial RNA extracts from Mmp14f/f and Mmp14f/f/Dermo1-Cre mice (n = 6). Data are presented as mean ± SEM. *p < 0.05, unpaired t test. (D) Microcomputed tomography of the proximal femur of 12-week-old Mmp14f/f and Mmp14f/f/Osterix-GFP-Cre mice. (E) BMD, BV/TV, Tb.Th, Tb.N, and Tb.Sp were determined by microcomputed tomography in 12-week-old Mmp14f/f and Mmp14f/f/Osterix-GFP-Cre mice (n = 10). Data are presented as mean ± SEM. *p < 0.05, **p < 0.01, unpaired t test. (F) Histology of femur from 12-week-old Mmp14f/f and Mmp14f/f/Osterix-GFP-Cre mice. The scale bar represents 1 mm. (G) Relative mRNA expression of adipogenic markers in bone-marrow RNA extracts from 12-week-old Mmp14f/f and Mmp14f/f/Osterix-GFP-Cre mice (n = 6). Data are presented as mean ± SEM. Not significant, unpaired t test. See also Figure S2.
Figure 3
Figure 3. MT1-MMP Regulates SSC Commitment and Differentiation
(A) Bone-marrow-derived SSCs were isolated from Mmp14+/+ and Mmp14−/− mice and cultured under osteogenic conditions for 7 days (alkaline phosphatase stained) or 14 days (alizarin red S stained) in 3D collagen, under adipogenic conditions in 3D collagen for 7 days (oil red O stained), or under chondrogenic conditions for 21 days (safranin O/fast green stained). The scale bars represent 100 μm. (B) Relative mRNA expression of osteogenic, adipogenic, and chondrogenic markers from the cultures shown in (A) (n = 3). Data are presented as mean ± SEM. **p < 0.01, unpaired t test. (C) Schematic of the overall experimental design for in vivo implantation. (D) Histology of tissues isolated from mice transplanted with Mmp14+/+ or Mmp14−/− SSCs. The scale bars represent 100 μm (n = 5). (E) Experimental design of chondrogenesis in vivo. (F) Safranin O staining and chondrogenic marker expression levels of cartilage-like tissues isolated from mice transplanted with Mmp14+/+ or Mmp14−/− SSCs cultured as described in (E). The scale bar represents 100 μm (n = 5). Data are presented as mean ± SEM. **p < 0.01, unpaired t test. See also Figure S3.
Figure 4
Figure 4. MT1-MMP-Dependent ECM Remodeling Regulates SSC Commitment by Activating β1-Integrin Signaling
(A) MT1-MMP−/− SSCs were transduced with lentivirus expressing HA-tagged WT MT1-MMP (WTMT1), an MT1-MMP mutant (MT1E/A), or an empty vector (EV). Collagen degradation results are shown in the left-hand panel (collagen colored red). The scale bar represents 200 μm. The expression of the HA-tagged MT1-MMP proteins is shown in the right-hand panel. (B) ALP and oil red O staining of SSCs from (A) cultured under osteogenic conditions in 3D collagen for 14 days or following safranin O staining of SSCs cultured under micromass chondrogenic conditions for 21 days. Relative mRNA expression of markers is shown in the right-hand panels (n = 3). The scale bars represent 100 μm. Data are presented as mean ± SEM. **p < 0.01, one-way ANOVA. (C) Collagen cleavage in newborn (1-day-old) calvarial bone and suture. The scale bar represents 50 μm. In the lower panels, collagen deposition in newborn calvarial bone and suture is shown as detected by confocal imaging of SHG signals (forward scattering, red; backward scattering, blue). The scale bar represents 50 μm. (D) Three-dimensional reconstruction and relative cell-surface area of SSCs isolated from Mmp14+/+/EGFP or Mmp14−/−/EGFP mice and cultured in 3D collagen. Data are presented as mean ± SEM. **p < 0.01, unpaired t test. (E) Immunofluorescence of total (green) and active (red) β1-integrin in SSCs isolated from Mmp14+/+ or Mmp14−/− mice and cultured in 3D collagen. The scale bar represents 15 μm. (F) Western blot of P-FAK, T-FAK, and total β1-integrin in SSCs isolated from Mmp14+/+ or Mmp14−/− mice and cultured in 3D collagen for 2 days. (G) Immunofluorescence of total and active β1-integrin in newborn calvarial cells of Mmp14f/f or Mmp14f/f/Dermo1-Cre mice. The scale bar represents 50 μm. (H) Western blot of P-FAK and T-FAK in calvarial lysates isolated from newborn Mmp14f/f or Mmp14f/f/Dermo1-Cre mice. (I) MT1-MMP−/− SSCs transduced with an empty vector lentivirus or viruses expressing either the human WT or mutant β1-integrins (G429N or V737N) were cultured in 3D collagen gels for 2 days and probed with anti-β1-integrin, P-FAK, and T-FAK antibodies. (J) Relative mRNA expression of osteogenic markers in the lentiviral-transduced cells from (I) cultured in 3D collagen for 7 days under osteogenic conditions (n = 3). Data are presented as mean ± SEM. **p < 0.01, one-way ANOVA. (K) Relative mRNA expression of adipogenic markers in SSCs shown in (I) cultured under adipogenic conditions in 3D collagen for 7 days (n = 3). Data are presented as mean ± SEM. **p < 0.01, one-way ANOVA. See also Figure S4.
Figure 5
Figure 5. β1-Integrin Activation and Three-Dimensional Cell-Shape Change
(A) Schematic of MT1-MMP+/+ and MT1-MMP−/− SSCs in 3D collagen coculture for 7 days under dual osteogenic/adipogenic induction. (B) Osteogenic and adipogenic markers quantified by real-time PCR in MT1-MMP+/+ and MT1-MMP−/− SSCs cocultured as described in (A) (n = 3). Data are presented as mean ± SEM. **p < 0.01, unpaired t test. (C) Schematic of PEG-based hydrogel. MT1-MMP-sensitive or -insensitive peptides were crosslinked to the PEG backbone with a cell-adhesive RGD peptide integrated into the hydrogel. (D) Phalloidin staining of MT1-MMP wild-type SSCs cultured in MT1-MMP-degradable or -nondegradable hydrogels for 15 days. The scale bar represents 10 μm. (E) Immunofluorescence of active β1-integrin in SSCs cultured in 3D PEG-based hydrogel for 15 days. The scale bar represents 15 μm. (F) Western blot of P-FAK and T-FAK in SSCs cultured in 3D PEG-based hydrogel for 15 days. (G) Relative mRNA expression of osteogenic markers in MT1-MMP+/+ SSCs cultured in 3D hydrogels (MMP-degradable or -nondegradable) for 15 days followed by a 7 day period under dual osteogenic/adipogenic induction (n = 3). Data are presented as mean ± SEM. **p < 0.01, unpaired t test. (H) Relative mRNA expression of adipogenic markers in MT1-MMP+/+ SSCs cultured in 3D hydrogels (MMP-degradable or -nondegradable) for 15 days followed by a 7 day period under dual induction conditions (n = 3). Data are presented as mean ± SEM. **p < 0.01, unpaired t test. See also Figure S5.
Figure 6
Figure 6. ECM Remodeling Regulates RhoGTPase Signaling, Pericellular Rigidity, and SSC Commitment
(A) Active and total RhoGTPase levels were determined in SSCs isolated from Mmp14+/+ or Mmp14−/− mice and cultured in 3D collagen for 2 days as well as in newborn calvarial lysates isolated from Mmp14f/f or Mmp14f/f/Dermo1-Cre mice. Data are presented as mean ± SEM. **p < 0.01, unpaired t test. (B) Active and total RhoGTPase levels were determined in SSCs isolated from Mmp14−/− mice that were transduced with empty vector or lentiviral constructs expressing WT MT1-MMP (WTMT1) or mutant MT1-MMP (MT1E/A) and cultured in 3D collagen for 2 days. Data are presented as mean ± SEM. **p < 0.01, one-way ANOVA. (C) Active and total RhoGTPase levels in SSCs isolated from Mmp14+/+ mice and cultured in 3D collagen with rat IgG or anti-β1-integrin antibody for 2 days. Data are presented as mean ± SEM. **p < 0.01, unpaired t test. (D) Schematic of local collagen rigidity assayed by microrheology. Beads are trapped and oscillated in a laser trap where bead position is detected by a quadrant photodiode. The interaction between the elastic force from the matrix and the optical force from the laser is used to determine the elastic modulus (G’). (E) G’ values near (<5 μm) and distant (>100 μm) from MT1-MMP+/+ and MT1-MMP−/− SSCs cultured in 3D collagen are shown. Each point represents the average G’ (across frequencies) for each bead. Data are presented as mean ± SEM. **p < 0.01, one-way ANOVA. (F) Relative mRNA expression of osteogenic and adipogenic markers in MT1-MMP+/+ SSCs cultured in 3D collagen and treated with or without 10 μM Y27632 for 7 days under osteogenic or adipogenic conditions, respectively (n = 3). Data are presented as mean ± SEM. **p < 0.01, unpaired t test. (G) Alcian blue staining of MT1-MMP+/+ SSCs cultured in 3D collagen and treated with or without 10 μM Y27632 for 21 days under chondrogenic conditions. The scale bar represents 100 μm. Relative mRNA expression of chondrogenic markers is shown in the right-hand panel (n = 3). Data are presented as mean ± SEM. **p < 0.01, unpaired t test. See also Figure S6.
Figure 7
Figure 7. MT1-MMP-Dependent YAP/TAZ Activation Triggers SSC Commitment
(A) YAP and TAZ expression levels in MT1-MMP+/+ SSCs embedded in 3D collagen gels for 2 days and treated with Rho inhibitor C3 (3 μg/ml), ROCK inhibitor Y27632 (10 μM), latrunculin A (Lat A; 0.5 μM), or cytochalasin D (CytoD; 1 μM). (B) Quantification of nuclear-stained cells from (A) (n = 3). Data are presented as mean ± SEM. **p < 0.01, one-way ANOVA. (C) YAP and TAZ expression levels in MT1-MMP+/+ or MT1-MMP−/− SSCs embedded in 3D collagen gels for 2 days. (D) YAP and TAZ localization in MT1-MMP+/+ or MT1-MMP−/− SSCs embedded in 3D collagen gels for 2 days. The scale bar represents 20 μm. (E) Quantification of nuclear-stained cells from (D) (n = 3). Data are presented as mean ± SEM. **p < 0.01, unpaired t test. (F) YAP and TAZ expression levels in MT1-MMP−/− SSCs infected with an empty vector or lentiviral constructs expressing G429N or V737N β1-integrin mutants and cultured in 3D collagen for 2 days. (G) YAP and TAZ localization in cells from (F) embedded in 3D collagen gels for 2 days. The scale bar represents 20 μm. (H) Quantification of nuclear-stained cells from (G) (n = 3). Data are presented as mean ± SEM. **p < 0.01, one-way ANOVA. (I) Expression of YAP-5SA probed with an anti-Flag antibody in MT1-MMP−/− SSCs infected with a lentiviral empty vector or virus expressing Flag-tagged YAP-5SA. (J) Osteogenic marker expression in MT1-MMP−/− SSCs infected with a lentiviral control vector or virus expressing Flag-tagged YAP-5SA, embedded in 3D collagen, and cultured for 7 days under osteogenic conditions (n = 3). Data are presented as mean ± SEM. **p < 0.01, unpaired t test. (K) Adipogenic marker expression in MT1-MMP−/− SSCs infected with a lentiviral control vector or virus expressing Flag-tagged YAP-5SA, embedded in 3D collagen, and cultured for 7 days under adipogenic conditions (n = 3). Data are presented as mean ± SEM. **p < 0.01, unpaired t test. (L) Chondrogenic marker expression in MT1-MMP−/− SSCs infected with a lentiviral control vector or a virus expressing Flag-tagged YAP-5SA and cultured in 3D collagen for 14 days under chondrogenic conditions (n = 3). Data are presented as mean ± SEM. *p < 0.05, **p < 0.01, unpaired t test. (M) YAP and TAZ localization in newborn calvaria of Mmp14f/f or Mmp14f/f/Dermo1-Cre mice. The scale bar represents 50 μm. (N) YAP and TAZ protein levels in newborn Mmp14f/f or Mmp14f/f/Dermo1-Cre calvarial lysates. (O) Histology of tissue isolated from mice transplanted with MT1-MMP−/− SSCs transduced with a lentiviral control vector or viruses expressing either Flag-tagged YAP-5SA or TAZ-S89A (n = 5). The scale bar represents 100 μm. (P) Schematic model of MT1-MMP-dependent control of SSC lineage commitment. See also Figure S7.

Comment in

Similar articles

Cited by

References

    1. Anjos-Afonso F, Bonnet D. Isolation, culture, and differentiation potential of mouse marrow stromal cells. Curr. Protoc. Stem Cell. Biol. 2008;7:2B.3.1–2B.3.11. - PubMed
    1. Chan CK, Chen CC, Luppen CA, Kim JB, DeBoer AT, Wei K, Helms JA, Kuo CJ, Kraft DL, Weissman IL. Endochondral ossification is required for haematopoietic stem-cell niche formation. Nature. 2009;457:490–494. - PMC - PubMed
    1. Chan KM, Wong HL, Jin G, Liu B, Cao R, Cao Y, Lehti K, Tryggvason K, Zhou Z. MT1-MMP inactivates ADAM9 to regulate FGFR2 signaling and calvarial osteogenesis. Dev. Cell. 2012;22:1176–1190. - PubMed
    1. Chun TH, Hotary KB, Sabeh F, Saltiel AR, Allen ED, Weiss SJ. A pericellular collagenase directs the 3-dimensional development of white adipose tissue. Cell. 2006;125:577–591. - PubMed
    1. Chun TH, Inoue M, Morisaki H, Yamanaka I, Miyamoto Y, Okamura T, Sato-Kusubata K, Weiss SJ. Genetic link between obesity and MMP14-dependent adipogenic collagen turnover. Diabetes. 2010;59:2484–2494. - PMC - PubMed

Publication types

MeSH terms