. 2013 Jun 12;32(12):1681-701.
doi: 10.1038/emboj.2013.105. Epub 2013 May 17.

HOT1 is a mammalian direct telomere repeat-binding protein contributing to telomerase recruitment

Affiliations

HOT1 is a mammalian direct telomere repeat-binding protein contributing to telomerase recruitment

Dennis Kappei et al. EMBO J. .

Abstract

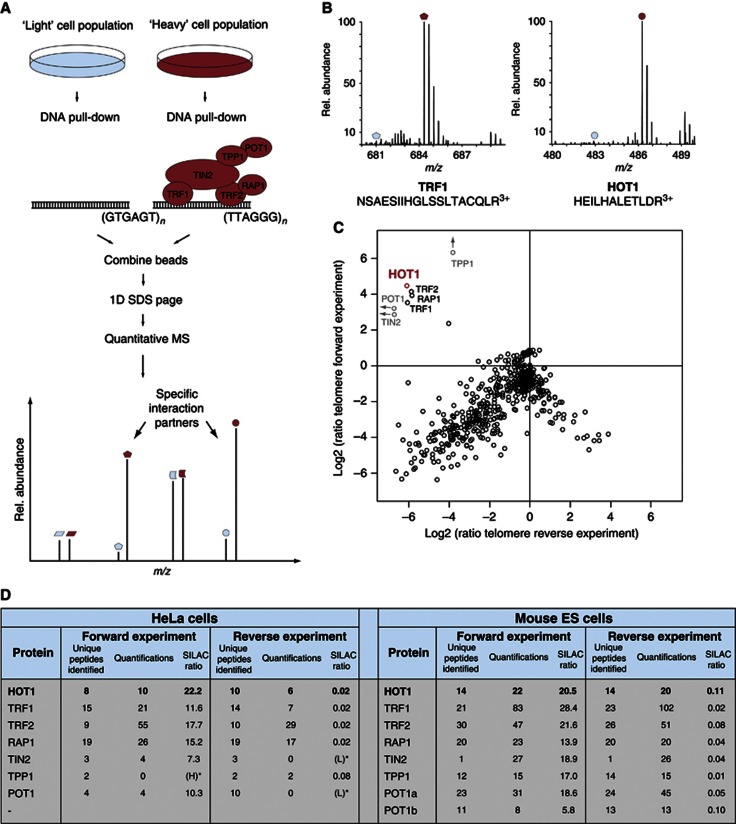
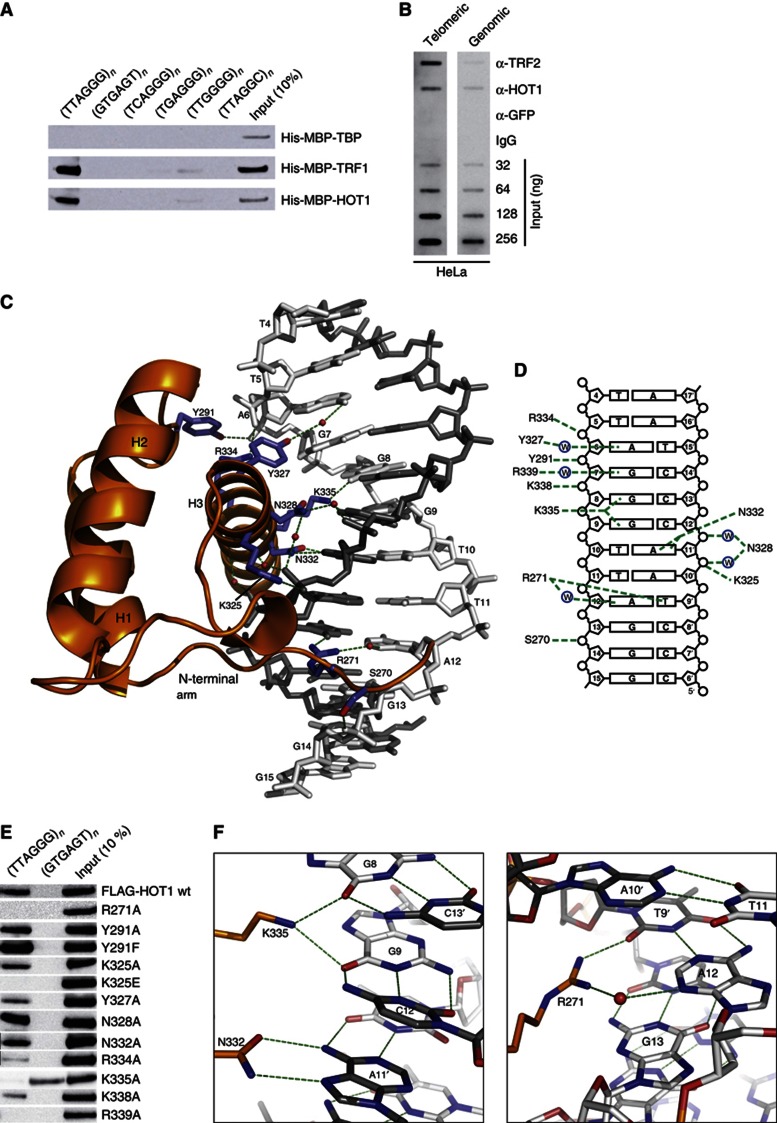
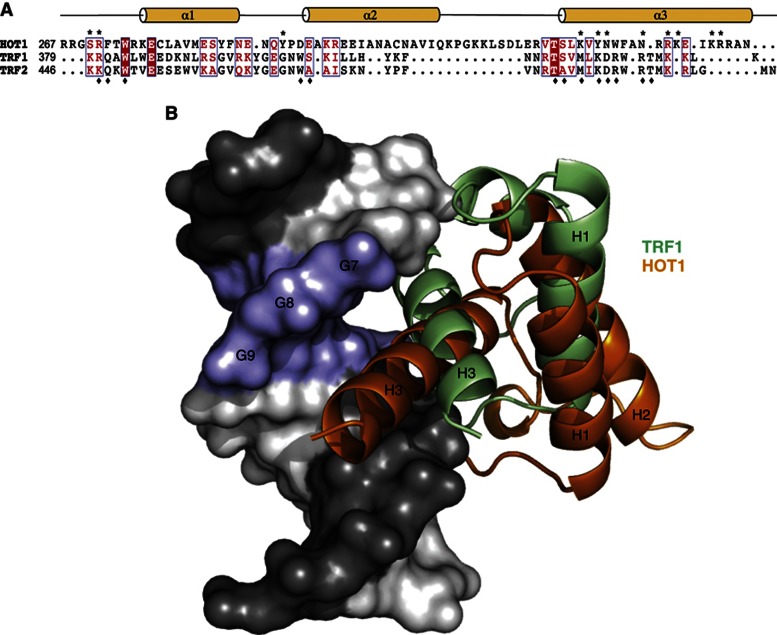
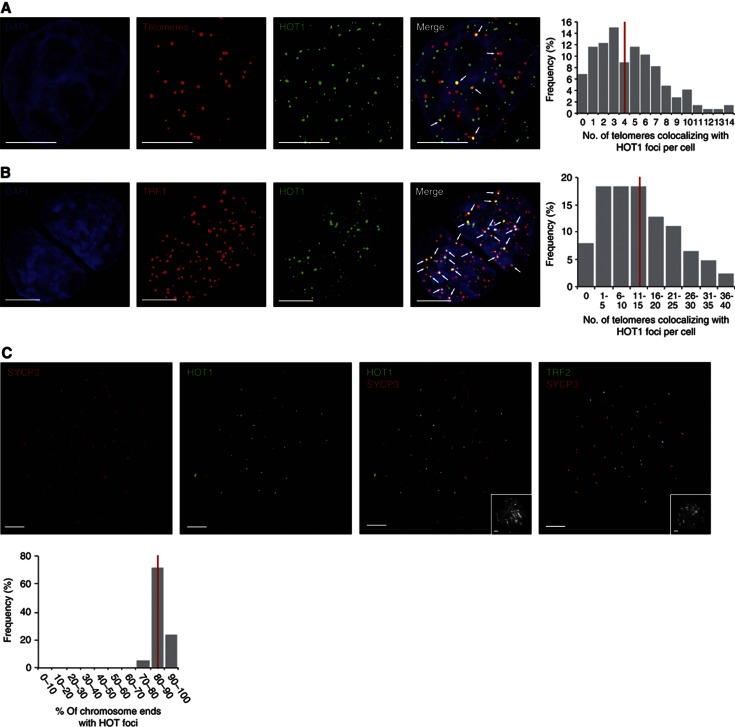
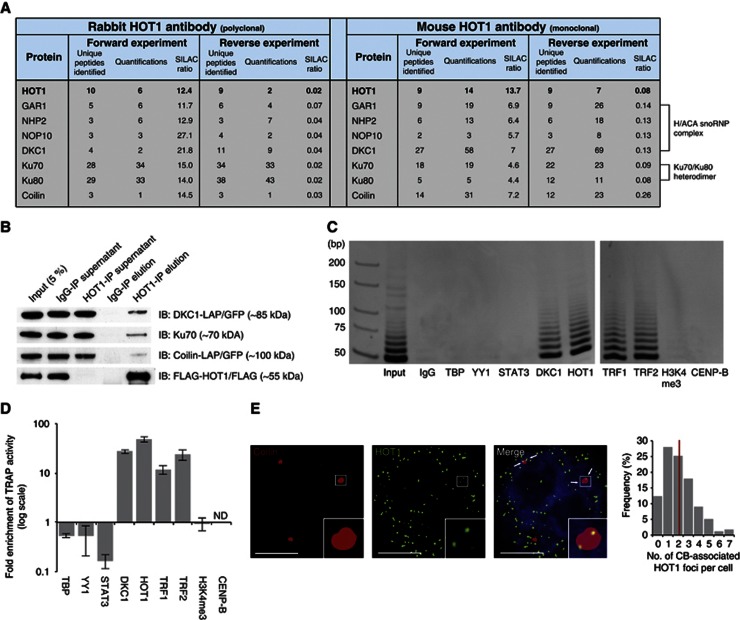
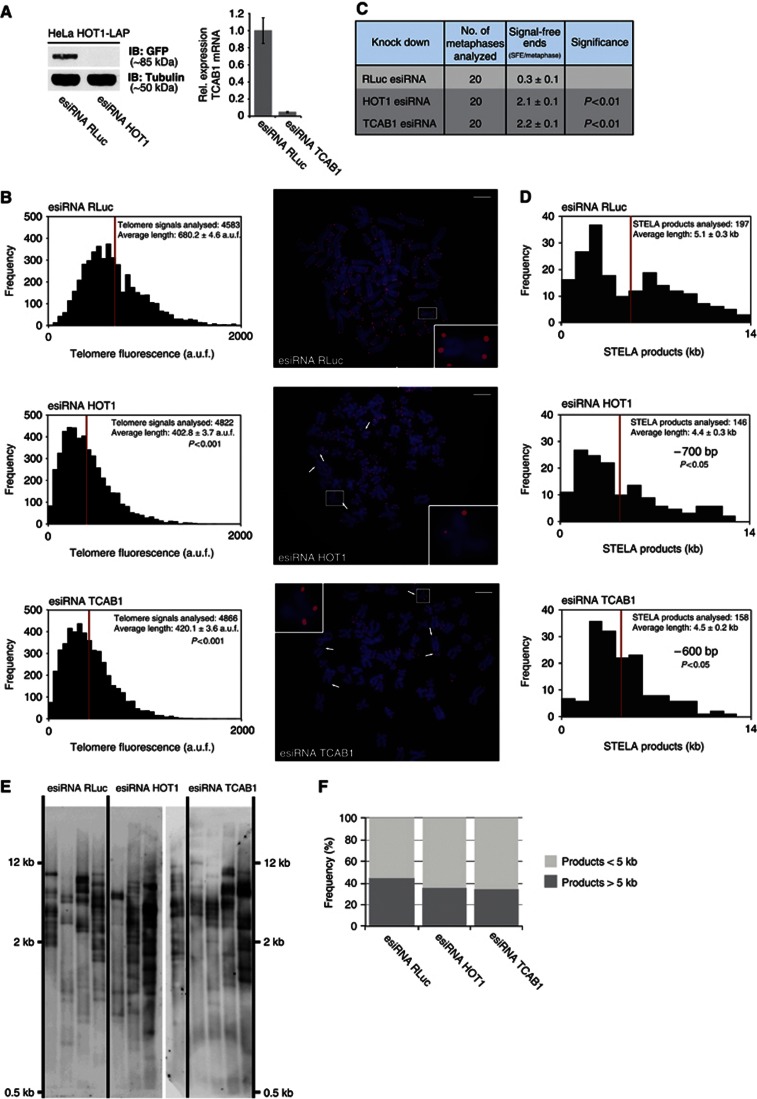
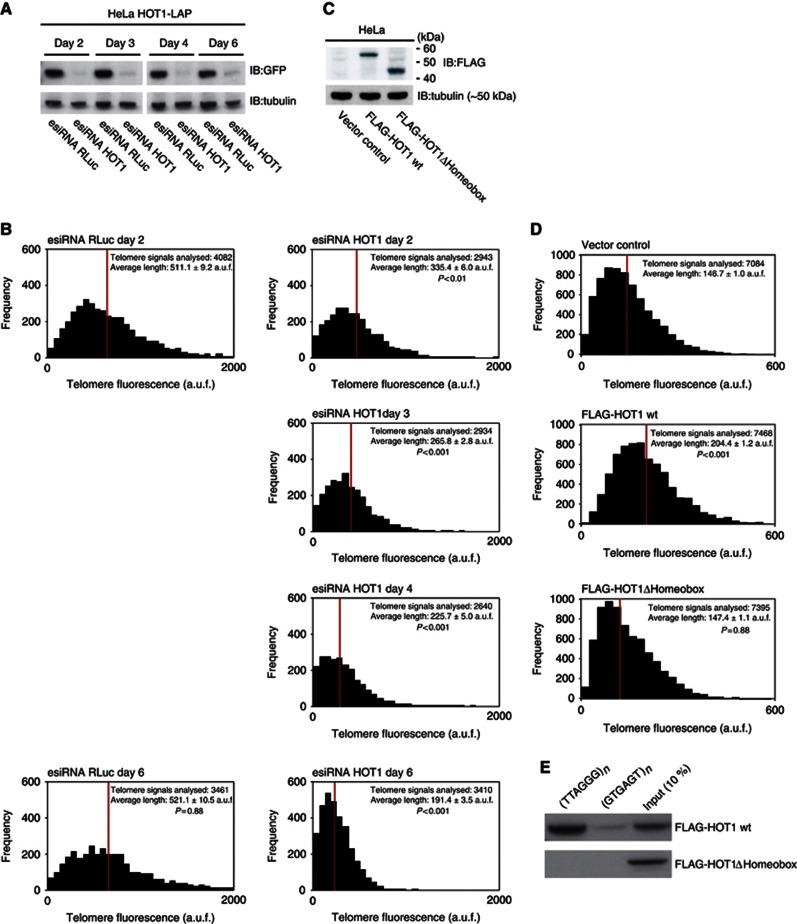
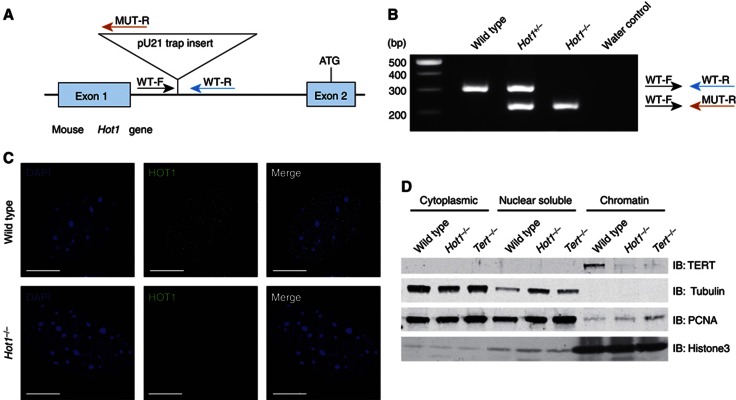
Telomeres are repetitive DNA structures that, together with the shelterin and the CST complex, protect the ends of chromosomes. Telomere shortening is mitigated in stem and cancer cells through the de novo addition of telomeric repeats by telomerase. Telomere elongation requires the delivery of the telomerase complex to telomeres through a not yet fully understood mechanism. Factors promoting telomerase-telomere interaction are expected to directly bind telomeres and physically interact with the telomerase complex. In search for such a factor we carried out a SILAC-based DNA-protein interaction screen and identified HMBOX1, hereafter referred to as homeobox telomere-binding protein 1 (HOT1). HOT1 directly and specifically binds double-stranded telomere repeats, with the in vivo association correlating with binding to actively processed telomeres. Depletion and overexpression experiments classify HOT1 as a positive regulator of telomere length. Furthermore, immunoprecipitation and cell fractionation analyses show that HOT1 associates with the active telomerase complex and promotes chromatin association of telomerase. Collectively, these findings suggest that HOT1 supports telomerase-dependent telomere elongation.


Conflict of interest statement

DK, F Butter, MM and F Buchholz declare a patent application of this work as patent PCT/EP2011/065943. The remaining authors declare that they have no conflict of interest.

Figures

Figure 1
Figure 1
Detection of specific telomere-interacting proteins. (A) A schematic of the quantitative SILAC-based DNA interaction screen with DNA oligonucleotides containing either the telomeric repeat or a control sequence. Specific interaction partners are differentiated from background binders by a SILAC ratio other than 1:1. (B) MS spectra of representative peptides from the ‘forward’ pull-down experiment. The heavy peptide partners are easily detected (red dots), while the light partner is barely observable (blue dots) in the mass spectrum. (C) Two-dimensional interaction plot: known shelterin components cluster together with HOT1, demonstrating enrichment at the telomere sequence compared to the control sequence. (D) Summary of the MS data for HOT1 and the core shelterin components from the SILAC-based DNA–protein interaction screens carried out with nuclear extracts derived from HeLa and murine ES cells.
Figure 2
Figure 2
The DBD of human HOT1 recognizes telomeric DNA in a sequence-specific manner. (A) Sequence-specific pull-down of recombinant HOT1, TRF1 (positive control) and TBP (TATA-binding protein, negative control). Proteins were incubated with dsDNA of telomeric repeats (5′-TTAGGG-3′), the control sequence (5′-GTGAGT-3′), the subtelomeric repeat variants (5′-TCAGGG-3′, 5′-TGAGGG-3′ and 5′-TTGGGG-3′, as well as the C. elegans telomere repeat 5′-TTAGGC-3′). All DNA substrates were concatemerized from 60 bp oligonucleotides to larger DNA fragments (on average at least 1 kb). (B) ChIP of telomeric DNA using antibodies against HOT1, TRF2 (positive control), GFP and IgG (negative controls). Representative slotblot images are shown for ChIP from HeLa extracts after hybridization with a telomeric and genomic control. Input dilutions demonstrate the linearity of the signals acquired. (C) Structure of the DBD of HOT1 bound to double-stranded telomeric DNA. The protein is shown as a cartoon representation (orange), whereas DNA is shown as a stick model (grey). The interacting amino acid residues in HOT1 are shown as blue sticks, water molecules as red spheres and protein–DNA contacts are visualized as green dashed lines. (D) Schematic representation of all protein–DNA contacts in the complex. (E) Sequence-specific pull-down of FLAG–HOT1 and selected single mutations to investigate binding specificity. Proteins were incubated with either telomeric repeats (5′-TTAGGG-3′) or a control oligonucleotide (5′-GTGAGT-3′). (F) Atomic details of DNA sequence recognition by HOT1. K335 of helix 3 is involved in direct hydrogen bonding to O6 of G8 and O6 of G9. N332 of helix 3 specifically recognizes A11′ of the complementary strand by forming two direct H-bonds with the bicyclic ring system of A11′ (N6 and N7) (left panel). R271 of the N-terminal arm binds two bases of an AT base pair, directly to T9′ and via a water-mediated H-bond to A12 (right panel). Source data for this figure is available on the online supplementary information page.
Figure 3
Figure 3
Comparison of the molecular recognition of telomeric DNA by HOT1 and TRFs. (A) Schematic representation of the domain structure of the homeobox domains of TRF1, TRF2 and HOT1. Residues involved in DNA binding are marked with an asterisk (HOT1) or diamond (TRF1). Strictly conserved residues are shown with white font on red background and conserved residues are written in red font. (B) Superposition of structures of the HOT1 DBD and TRF1 DBD bound to telomeric DNA. Both binding domains recognize a different set of DNA bases, resulting in a different positioning relative to the 5′-TTAGGG-3′ motif.
Figure 4
Figure 4
The degree of HOT1–telomere association varies between cell types. (A) Colocalization analysis of telomeres and HOT1 in HeLa cells by immunoFISH staining. A representative image illustrating the colocalization between several HOT1 foci (green) and telomeres (red) is shown. DAPI (blue) is used as nuclear counterstain. Colocalization events are indicated by arrows. Scale bars represent 5 μm. The quantification of the frequency of colocalization events was done after a 3D reconstruction of the acquired Z-stacks (n=147). The average value is indicated by a red bar. (B) Colocalization analysis of TRF1 and HOT1 in mouse ES cells by IF staining. To visualize TRF1 a LAP cell line (Poser et al, 2008) was used, expressing GFP-tagged TRF1 at endogenous expression levels. A representative image illustrating the colocalization between several HOT1 foci (green) and TRF1 (red) is shown. DAPI (blue) is used as a nuclear counterstain. Colocalization events are indicated by arrows. Scale bars represent 5 μm. The quantification of the frequency of colocalization events was done after a 3D reconstruction of the acquired Z-stacks (n=126). The average value is indicated by a red bar. (C) IF stainings of HOT1 at chromosome ends of mouse pachytene chromosome spreads. Representative images illustrating the localization of HOT1 and TRF2 (in green) to chromosome ends are shown. The synaptonemal complex/chromosome axis is marked by SYCP3 (red). The same field of view for the DNA counterstained by DAPI (greyscale) is shown in the bottom right corners. Scale bars represent 5 μm. The quantification of HOT1 foci at chromosome ends was done after a 3D reconstruction of the acquired Z-stacks (n=21). The average value is indicated by a red bar.
Figure 5
Figure 5
HOT1 associates with telomerase and CB complex components. (A) Summary of SILAC-based protein–protein interactions. Identification and normalized SILAC ratios are indicated for HOT1 (bait) and the identified interaction partner relevant for telomere biology from immunoprecipitation using both a rabbit and a mouse anti-HOT1 antibody. (B) Validation of the MS identifications by conventional immunoprecipitation. Nuclear HeLa extracts were subject to immunoprecipitation with either a polyclonal rabbit anti-HOT1 or an IgG antibody, and were immunoblotted for DKC1, Ku70 and Coilin. HOT1 IPs for the coprecipitation of DKC1 and Coilin were carried out in corresponding LAP cell lines (Poser et al, 2008) and both proteins were detected with anti-GFP antibody. FLAG–HOT1 was used to monitor the efficiency of the IP and a representative blot is shown. (C) Visualization of telomerase activity enrichment by gel electrophoresis in immunoprecipitations using antibodies against HOT1, DKC1 (positive control), TBP, YY1, STAT3, H3K4me3 and CENP-B (negative controls), as well as TRF1 and TRF2, using extracts from HeLa cells. All antibodies are rabbit polyclonal. A representative gel image of quantitative TRAP reaction products is shown. Samples were loaded on two gels and run in parallel represented by a gap between gel pictures. (D) Quantification of telomerase activity enrichment from the immunoprecipitations in panel C. Enrichments are normalized to immunoprecipitations using an IgG control. Error bars represent the s.d. of three independent experiments. Enrichments for DKC1, HOT1, TRF1 and TRF2 are statistically significant with P<0.05 (Student’s t-test). (E) Colocalization analysis of Coilin and HOT1 in HeLa cells by immunofluorescence staining. A representative image illustrating the colocalization between several HOT1 foci (green) and CBs (red; staining for Coilin) is shown. DAPI (blue) is used as nuclear counterstain. Colocalization events are indicated by arrows. An enhanced magnification of the boxed area is shown in the bottom right corners. Scale bars represent 5 μm. The quantification of the frequency of colocalization events was done after a 3D reconstruction of the acquired Z-stacks (n=179). The average value is indicated by a red bar. Source data for this figure is available on the online supplementary information page.
Figure 6
Figure 6
HOT1 regulates telomere length similar to the telomerase pathway member TCAB1. (A) Verification of HOT1 knockdown efficiency by western blot 48 h post transfection using the corresponding LAP cell line (Poser et al, 2008) as a reporter for protein expression. The TCAB1 knockdown was evaluated by quantitative PCR 24 h post transfection. (B) Quantification of telomere length by quantitative telomeric FISH after transient knockdown of HOT1 and TCAB1. The distributions of fluorescence intensities, in arbitrary units of fluorescence (a.u.f.), of individual telomeres from a total of 20 metaphases per treatment are displayed; the average intensity is indicated in red. For the gene-specific knockdowns, changes of average telomere signal intensity relative to the RLuc (Renilla Luciferase) control are shown (left). Representative FISH images are shown for each treatment and signal-free ends are indicated by arrows (right). Examples of individual chromosomes are magnified and the respective chromosomes are marked by rectangles (right). Scale bars represent 5 μm. (C) Summary of the quantification of signal-free ends per metaphase after gene-specific knockdown. (D) Quantification of telomere length by universal STELA after transient knockdown of HOT1 and TCAB1. The distributions of telomere length groups in kb of individual telomeres are displayed; the average length is indicated in red and averages are stated with the respective s.e.m. Changes of average telomere length are shown relative to the RLuc (Renilla Luciferase) control. (E) Raw data of STELA reactions for the quantification of telomere length. STELA products after gel electrophoresis, transfer and hybridization from 12 individual reactions (lanes) per treatment are shown. Samples were loaded on two gels and were run in parallel, represented by a gap within HOT1 esiRNA lanes. (F) Quantification of the frequency of short STELA products (<5 kb) relative to long STELA products (>5 kb). Five kilobases were used as a cut-off value based on this being the average telomere length as determined in the RLuc control. Source data for this figure is available on the online supplementary information page.
Figure 7
Figure 7
HOT1 acts as a positive regulator of telomere length. (A) Verification of HOT1 esiRNA knockdown efficiency using a HOT1-LAP cell line (Poser et al, 2008) as a reporter for HOT1 expression by western blot after 2, 3, 4 and 6 days. Cells analysed after 4 and 6 days were transfected twice: After the initial transfection, cells were transfected a second time on day 3 (72 h post transfection). All samples were run on the same gel, irrelevant lanes were spliced out. (B) Quantification of telomere length by quantitative telomeric FISH after transient knockdown of HOT1. The distributions of fluorescence intensities, in arbitrary units of fluorescence (a.u.f.), of individual telomeres from a total of 15–20 metaphases per treatment are displayed; the average intensity is indicated in red. Changes of average telomere signal intensity are shown relative to the RLuc (Renilla Luciferase) control. (C) Verification of FLAG–HOT1 and FLAG–HOT1ΔHomeobox expression by western blot 48 h post transfection. (D) Results of telomere length measurements after transient overexpression of FLAG–HOT1 and FLAG–HOT1ΔHomeobox. The distributions of fluorescence intensities, in a.u.f., of individual telomeres from a total of 30 metaphases per treatment are displayed; the average intensity is indicated in red. (E) Sequence-specific pull-down of FLAG–HOT1 and FLAG–HOT1ΔHomeobox. Proteins were incubated with either telomeric repeats (5′-TTAGGG-3′) or a control oligonucleotide (5′-GTGAGT-3′). Source data for this figure is available on the online supplementary information page.
Figure 8
Figure 8
TERT binding to chromatin is dependent on HOT1. (A) Schematic of the genetrap insertion in the Hot1 gene. (B) PCR genotyping. Genomic DNA from wild-type, heterozygous and homozygous mice were analysed by PCR. Genotypes were confirmed using three primers WT-F, WT-R and MUT-R. WT-F and WT-R amplify the wild-type allele (upper band), and WT-F and MUT-R amplify the genetrap allele (lower band). (C) Immunofluorescence stainings of HOT1 on wild-type and Hot1Gt(pU-21T)346Card/(Gt(pU-21T)346Card MEFs (referred to as Hot1−/− MEFs). HOT1 foci (green) are absent in Hot1−/− MEFs. DAPI (blue) is used as a nuclear counterstain. Scale bars represent 5 μm. (D) Subcellular fractionation analysis of wild-type, Hot1−/− and Tert−/− MEFs. Tubulin, PCNA and Histone3 serve as loading controls and to monitor the cell fractionation. Source data for this figure is available on the online supplementary information page.

Comment in

  • It's getting HOT at telomeres.
    Tarsounas M. Tarsounas M. EMBO J. 2013 Jun 12;32(12):1655-7. doi: 10.1038/emboj.2013.119. Epub 2013 May 17. EMBO J. 2013. PMID: 23685360 Free PMC article.

References

    1. Abreu E, Aritonovska E, Reichenbach P, Cristofari G, Culp B, Terns RM, Lingner J, Terns MP (2010) TIN2-tethered TPP1 recruits human telomerase to telomeres in vivo. Mol Cell Biol 30: 2971–2982 - PMC - PubMed
    1. Adelfalk C, Janschek J, Revenkova E, Blei C, Liebe B, Göb E, Alsheimer M, Benavente R, de Boer E, Novak I, Höög C, Scherthan H, Jessberger R (2009) Cohesin SMC1beta protects telomeres in meiocytes. J Cell Biol 187: 185–199 - PMC - PubMed
    1. Afonine PV, Grosse-Kunstleve RW, Adams PD (2005) The Phenix refinement framework. CCP4 Newslett 42:
    1. Araki M, Araki K, Yamamura K-I (2009) International Gene Trap Project: towards gene-driven saturation mutagenesis in mice. Curr Pharm Biotechnol 10: 221–229 - PubMed
    1. Aubert G, Hills M, Lansdorp PM (2012) Telomere length measurement-caveats and a critical assessment of the available technologies and tools. Mutat Res 730: 59–67 - PMC - PubMed

Publication types

MeSH terms