. 2013 May 30;497(7451):585-90.
doi: 10.1038/nature12160. Epub 2013 May 19.

The importance of mixed selectivity in complex cognitive tasks

Affiliations

The importance of mixed selectivity in complex cognitive tasks

Mattia Rigotti et al. Nature. .

Abstract

Single-neuron activity in the prefrontal cortex (PFC) is tuned to mixtures of multiple task-related aspects. Such mixed selectivity is highly heterogeneous, seemingly disordered and therefore difficult to interpret. We analysed the neural activity recorded in monkeys during an object sequence memory task to identify a role of mixed selectivity in subserving the cognitive functions ascribed to the PFC. We show that mixed selectivity neurons encode distributed information about all task-relevant aspects. Each aspect can be decoded from the population of neurons even when single-cell selectivity to that aspect is eliminated. Moreover, mixed selectivity offers a significant computational advantage over specialized responses in terms of the repertoire of input-output functions implementable by readout neurons. This advantage originates from the highly diverse nonlinear selectivity to mixtures of task-relevant variables, a signature of high-dimensional neural representations. Crucially, this dimensionality is predictive of animal behaviour as it collapses in error trials. Our findings recommend a shift of focus for future studies from neurons that have easily interpretable response tuning to the widely observed, but rarely analysed, mixed selectivity neurons.


Figures

Figure 1
Figure 1
Low and high-dimensional neural representations, and mixed selectivity. a, Contour plots of the responses (spikes/s) of four hypothetical neurons to two continuous parameters that characterize two task-relevant aspects (a,b, varying between 0 and 1) corresponding to relevant stimulus features (e.g. contrast and orientation). Neurons 1,2 are pure selectivity neurons, selective to individual parameters (a and b, respectively). Neuron 3 is a linear mixed selectivity neuron: its response is a linear combination of the responses to parameters a and b. Neuron 4 is a non-linear mixed selectivity neuron: its response cannot be explained by a linear superposition of responses to the individual parameters. The green circles indicate the responses to three sensory stimuli parametrized by three a,b combinations. b, The responses of the pure and linear mixed selectivity neurons from a in the space of activity patterns (the axes indicate the firing rates of the neurons) elicited by the three stimuli indicated by the green circles in a lie on a line, therefore spanning a low-dimensional space. c, As in b, with the third neuron being the non-linear mixed selectivity Neuron 4 in a. The representations of the stimuli lie on a plane, no longer being confined on a line. This higher dimensionality plays an important role when the activity is read out by linear classifiers, since they can only separate the input space into classes that are separable by a plane (in general by a hyper-plane). This limits the implementable classifications (See Supplementary Section S.1). For example, in b it is impossible for any linear classifier to respond to the darker central circle and not to the other two. But it is possible in c, for instance for a linear classifier corresponding to an appropriately positioned horizontal plane.
Figure 2
Figure 2
Behavioural task from [3]. a, Sample sequence: each trial began when the monkeys grasped a bar and achieved central fixation. A first sample object was followed by a brief delay (the one-object delay), then a second sample object (different from the first sample object), then another delay (the two-object delay). b, Recognition task: the sample sequence was followed by a test sequence, which was either a match to the sample sequence, in which case the monkeys were required to release the bar, or a nonmatch, in which case the monkeys were required to hold the bar until a matching sequence appeared. c, Recall task: the sample sequence was followed by an array of three objects that included the two sample objects. Monkeys were required to make a sequence of saccades in the correct order to the two sample objects. Recognition and recall task trials were interleaved in blocks of 100–150 trials.
Figure 3
Figure 3
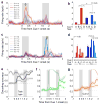
Mixed selectivity in recorded single-cell activity and population decoding. a, Average firing rate of a sample neuron (Gaussian smoothing with 100 ms window, shaded area indicates s.e.m). Colours denote different combinations of task type and sample cues (condition), indicated in parenthesis (task type, first cue, second cue). The ‘?’ indicates that cue 2 identities were averaged over. This neuron preferentially responds to object C as first cue in Task 1 blocks (recognition task). b, Peri-condition histogram (PCH): average firing rate in a 100 ms time bin (±s.e.m) at the yellow arrow in a for different conditions. The response to object C as first cue is significantly different for the two task types (p < 0.05, two-sample t-test). c,d, Same as a,b for a different neuron with preference for object A and D as second objects during task 2 trials (recall task). e–g, Comparison of population decoding accuracy for task type (e), cue 1 (f) and cue 2 (g) before (dashed) and after (solid) removing classical selectivity. Dashed lines: average trial-by-trial cross-validated decoding accuracy of the decoder reading out the firing rate of 237 neurons in different independent time bins. Curves represent the average decoding accuracy over 1000 partitions of the data into training and test set (shaded areas show 95% confidence intervals). Horizontal dashed lines indicate chance level. Solid lines: decoding accuracy after the removal of classical selectivity for 237 (bright) and 1000 resampled neurons (dark) (see Supplementary Methods M.6). e, Accuracy in decoding task type from neurons whose selectivity to task type was removed. The decoding accuracy is initially at chance, but steadily grows above chance level as the complexity of the task and the number of conditions increases. f,g, analogous plots for the decoding accuracy of cue 1,2 identity, when instead selectivity to cue 1,2 was removed.
Figure 4
Figure 4
The recorded neural representations are high-dimensional. Number of implementable binary classifications, Nc, (left ordinate, on logarithmic scale) and dimensionality of the inputs (right ordinate, linear scale) for varying number of neurons of the population read out by a linear classifier. a, The black trace represents the number Nc of implementable binary classifications of the vectors of recorded mean firing rates in the 800 ms bin in the middle of the one-object delay period. In this epoch a trial is defined by one of c = 8 different conditions, corresponding to all the combinations of task type and cue 1 objects. Nc reaches the value that corresponds to the maximal dimensionality d = 8 (indicated by the dashed line). The grey line shows Nc when the neural representations contain only the responses of artificially generated pure selectivity neurons with a noise level matching that of the data (See Supplementary Methods M.4). b, Same plot computed over the 800 ms bin in the middle of the two-object delay period. The advantage of the recorded representations over the pure selectivity neurons is huge. For the recorded data (black line) Nc reaches 224, the value that corresponds to the maximal dimensionality d = 24, given by all possible combinations of cue 1 object, cue 2 object and task type are 24 (dashed line). On the other hand, representations based on pure selectivity (grey line) generate less than 8 dimensions. Error bars are 95% confidence bounds estimated as detailed in Supplementary Methods M.7. See Supplementary Section S.20 for this analysis during the test epochs.
Figure 5
Figure 5
The dimensionality of the neural representations predicts animal behaviour. a, Same plot as Fig. 4b, with the difference that the analysis is restricted to the recall task and the two curves represent the number of implementable binary classifications of the recorded activity in the case of correct (black) and error (grey) trials. For the correct trials the number of implementable classifications corresponds to a dimensionality that is close to maximal (d = 12, dashed line). In the error trials the dimensionality drops significantly. b, The identity of the two cues can still be decoded in the error trials: decoding accuracy as in Fig. 3 in the correct (continuous lines) and error trials (dashed lines) for the identity of cue 1 (green lines) and cue 2 (orange line). The correct cue identities are perfectly decoded also during error trials. c,d, Contribution of non-linear and linear mixed selectivity to the collapse in dimensionality observed in the error trials. c, After removing the linear component of mixed selectivity from the response of each neuron, the dimensionality is estimated as in a. The dimensionality in the correct trials (black line) is still significantly higher than in the error trials (grey line). d, Same as in c, but after the nonlinear component of mixed selectivity is subtracted from each neuron. The two curves are not significantly different, indicating that the non-linear component of mixed selectivity is responsible for the collapse in dimensionality. These analyses were carried out on a subset dataset of 121 neurons that were recorded in as many correct as error trials during the recall task.

References

    1. Asaad WF, Rainer G, Miller EK. Neuron. 1998 Dec;21(6):1399–1407. - PubMed
    1. Mansouri FA, Matsumoto K, Tanaka K. J Neurosci. 2006 Mar;26(10):2745–2756. - PMC - PubMed
    1. Warden MR, Miller EK. J Neurosci. 2010 Nov;30(47):15801–15810. - PMC - PubMed
    1. Buonomano DV, Merzenich MM. Science. 1995 Feb;267(5200):1028–1030. - PubMed
    1. Maass W, Natschlager T, Markram H. Neural Comput. 2002;14:2531–2560. - PubMed

Publication types