Case Reports
. 2013 Jun;72(6):960-70; discussion 970.
doi: 10.1227/NEU.0b013e31828cf619.

A case series of primary central nervous system posttransplantation lymphoproliferative disorder: imaging and clinical characteristics

Affiliations
Case Reports

A case series of primary central nervous system posttransplantation lymphoproliferative disorder: imaging and clinical characteristics

Wendell Lake et al. Neurosurgery. 2013 Jun.

Abstract

Background: Primary central nervous system posttransplantation lymphoproliferative disorder (PCNS-PTLD) is a rare complication after solid organ transplantation (SOT). With increasing rates of SOT, PCNS-PTLD incidence is increasing.

Objective: To describe the characteristics of PCNS-PTLD patients requiring neurosurgical intervention.

Methods: From 2000 to 2011, 10 patients with prior SOT underwent biopsy for evaluation of brain lesions and were diagnosed with PCNS-PTLD. Data collected included imaging characteristics, pathology, treatments administered, and survival outcomes.

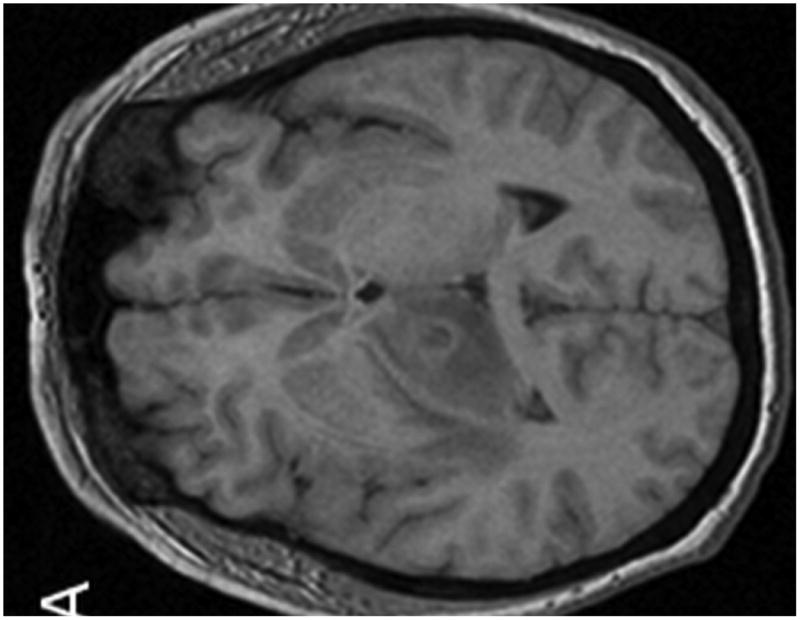
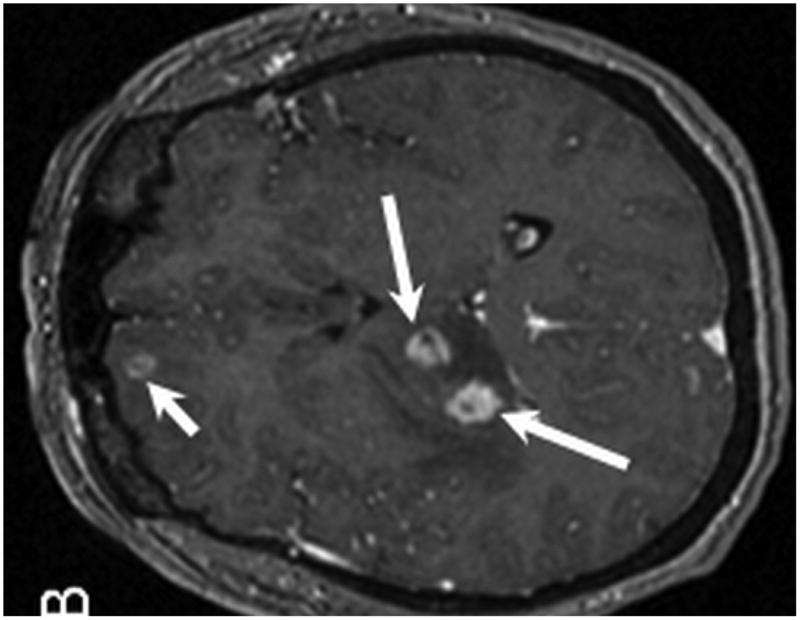
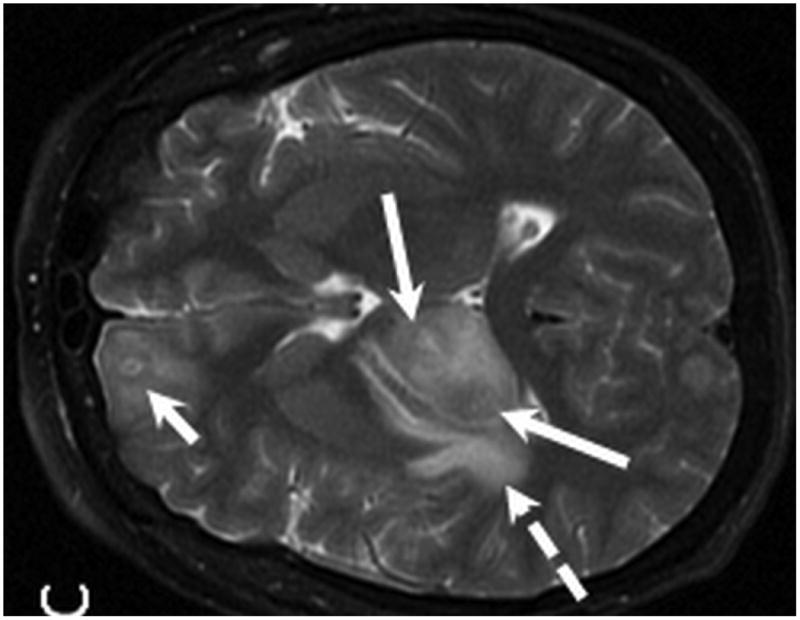
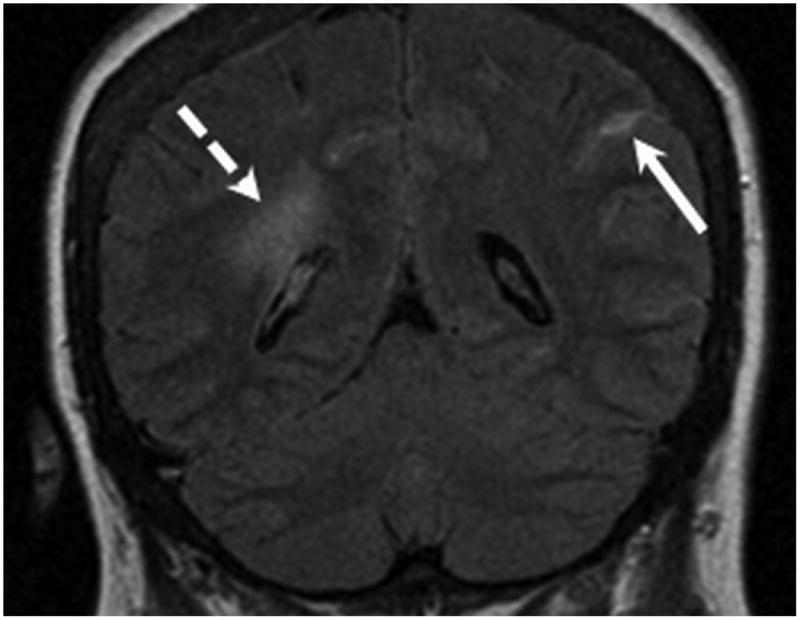
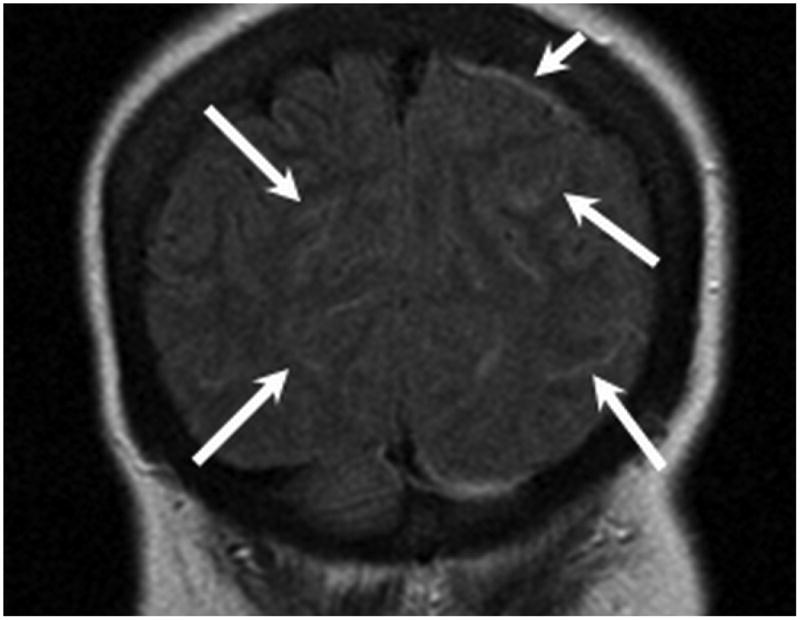
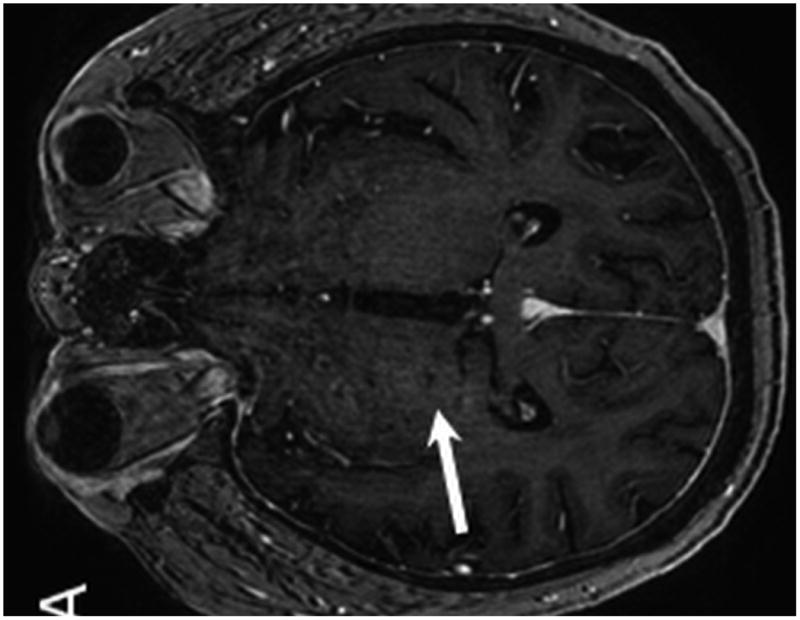
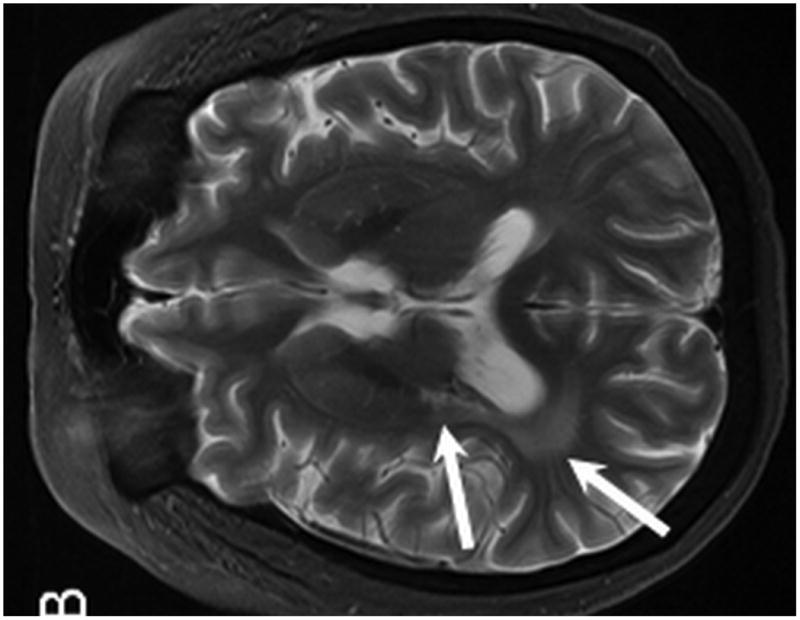
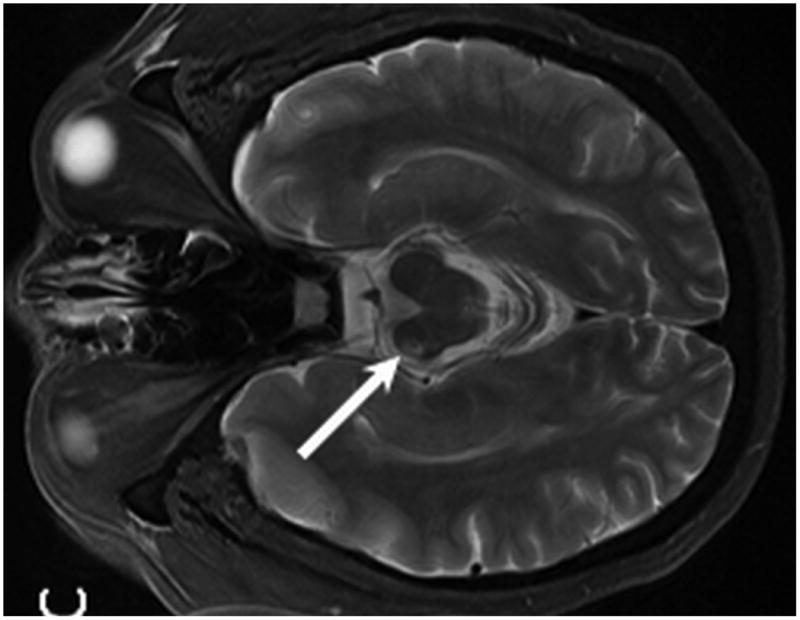
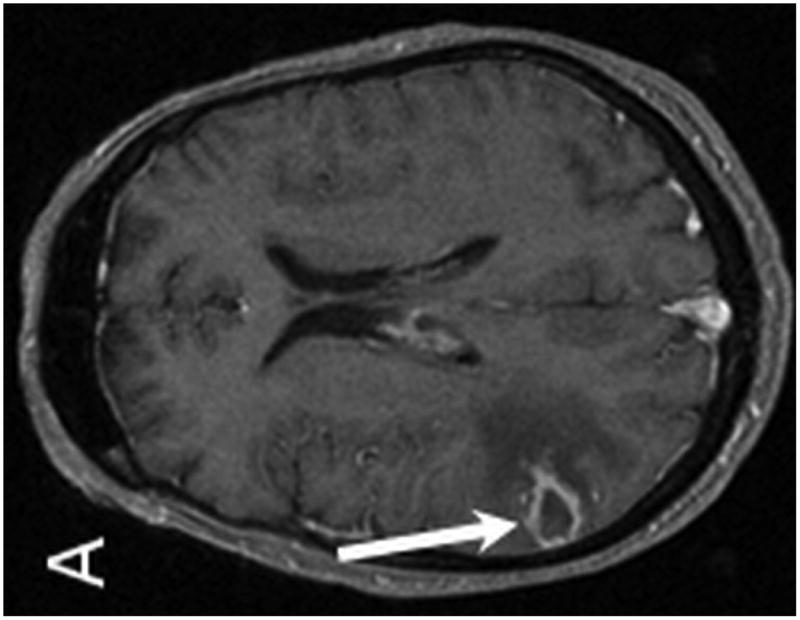
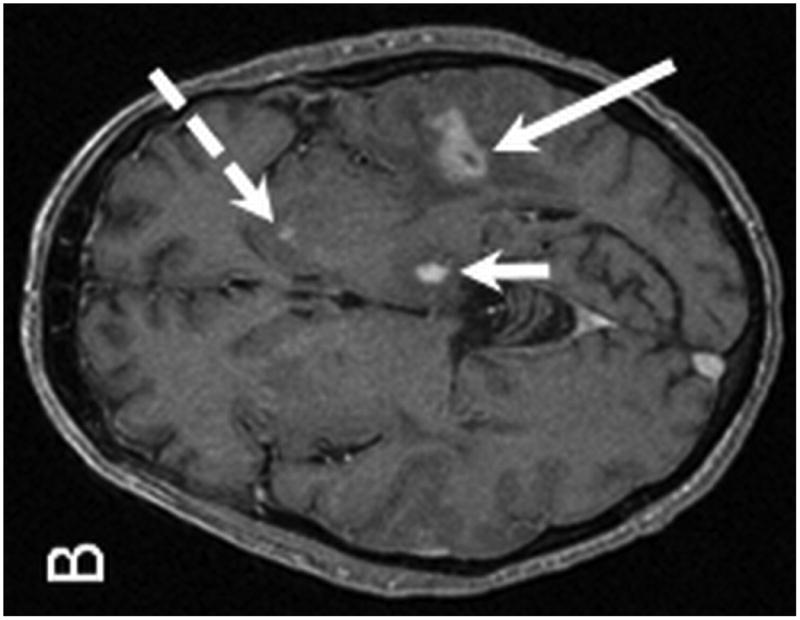
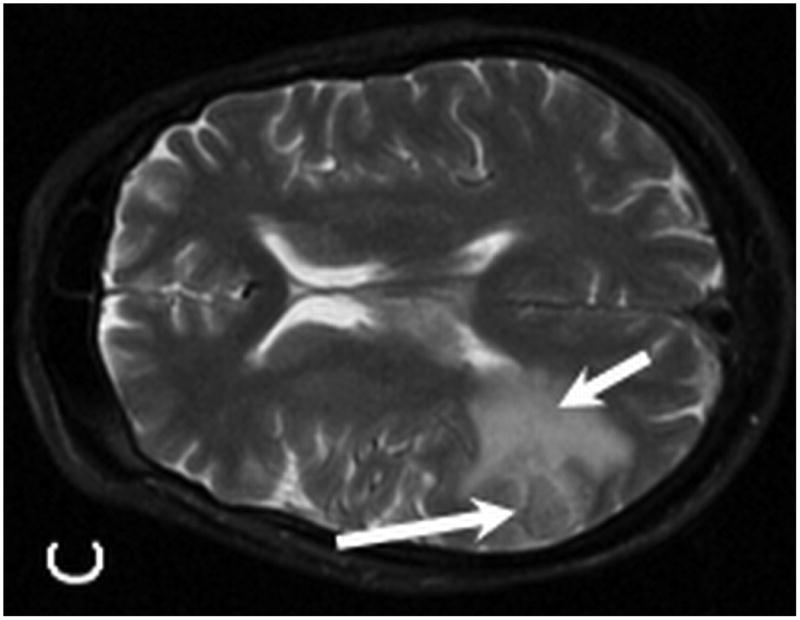
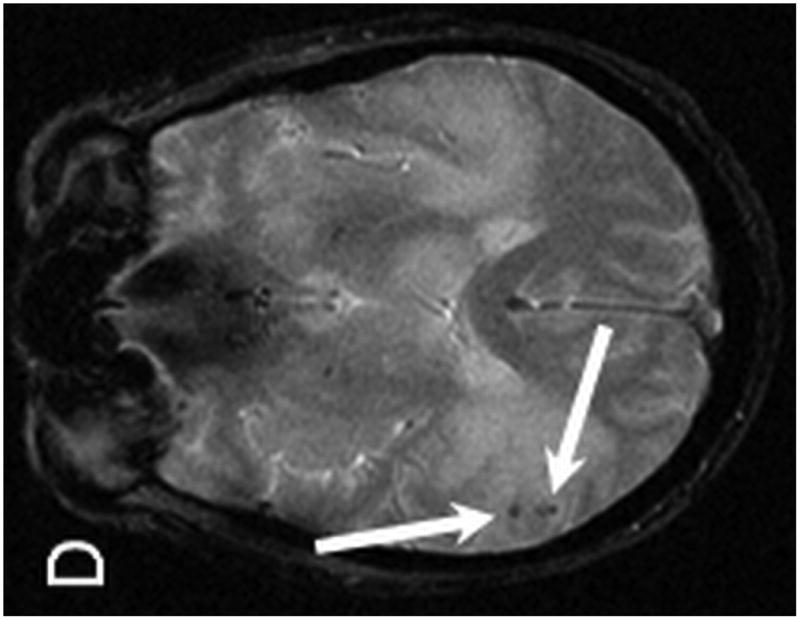
Results: All patients had kidney transplantation, and 3 had concurrent pancreas transplantation. Median age at diagnosis was 49 years, with a median of 4.5 years from SOT to diagnosis (range, 1.8-11.4 years). Presenting symptoms most often included focal neurological deficits (n = 6), although several patients had nonspecific symptoms of headache and altered mental status. Brain lesions were generally multiple (n = 7), supratentorial (n = 8), and lobar or periventricular in distribution with ring enhancement. Diagnosis was established by stereotactic (n = 4) and open surgical (n = 6) biopsy. Treatments most frequently administered included reduction of immunosuppression (n = 10), dexamethasone (n = 10), rituximab (n = 8), high-dose methotrexate (n = 3), and whole-brain radiotherapy (n = 6). Six patients remain alive without PCNS-PTLD relapse, including 4 patients who have sustained remissions beyond 2 years from diagnosis of PCNS-PTLD. Of 4 observed deaths, 1 was related to progressive PCNS-PTLD.

Conclusion: PCNS-PTLD must be considered in the differential diagnosis of any patient with prior SOT presenting with an intracranial lesion. Histological diagnosis with brain biopsy is imperative, given the risk for opportunistic infections that may have similar imaging findings and presentation. Prognosis is variable, although long-term survival has been reported.


Conflict of interest statement

Disclosures: The authors report no conflict of interest regarding the materials or methods used in this study or the findings specified in this paper.

Figures

Figure 1
Figure 1
MR examination from Case 1 at the time of initial presentation. Axial T1 (A), axial T1 post contrast (B) and axial T2 weighted MR images of the brain demonstrate 3 of the patient's intraparenchymal masses. These lesions demonstrate peripheral enhancement (B) and are slightly hyperintense on T2 (C) . Two lesions are located within the right thalamus (B and C, long arrows) and one is identified within the right frontal lobe (B, C, short arrows). Note the T2 hyperintense vasogenic edema surrounding the lesions (C, dashed arrow).
Figure 1
Figure 1
MR examination from Case 1 at the time of initial presentation. Axial T1 (A), axial T1 post contrast (B) and axial T2 weighted MR images of the brain demonstrate 3 of the patient's intraparenchymal masses. These lesions demonstrate peripheral enhancement (B) and are slightly hyperintense on T2 (C) . Two lesions are located within the right thalamus (B and C, long arrows) and one is identified within the right frontal lobe (B, C, short arrows). Note the T2 hyperintense vasogenic edema surrounding the lesions (C, dashed arrow).
Figure 2
Figure 2
MR examination from Case 1 obtained 10 days following initial presentation. Coronal FLAIR MR images (A,B) were obtained following contrast which demonstrate abnormal signal within multiple bilateral parietal and occipital lobe sulci (long arrows) consistent with leptomeningeal involvement. Pachymeningeal involvement is also present adjacent to the left parietal lobe (B, short arrow). As in Figure 1, note the vasogenic edema within the peri-atrial white matter related to the thalamic lesions (B, dashed arrow).
Figure 2
Figure 2
MR examination from Case 1 obtained 10 days following initial presentation. Coronal FLAIR MR images (A,B) were obtained following contrast which demonstrate abnormal signal within multiple bilateral parietal and occipital lobe sulci (long arrows) consistent with leptomeningeal involvement. Pachymeningeal involvement is also present adjacent to the left parietal lobe (B, short arrow). As in Figure 1, note the vasogenic edema within the peri-atrial white matter related to the thalamic lesions (B, dashed arrow).
Figure 3
Figure 3
MR from Case 1 obtained 3.5 years following treatment. Axial T1 post contrast MR (A) shows no evidence of enhancement within the areas of prior PTLD within the right thalamus (A, arrow). Axial T2 W MR images (B, C) demonstrate interval development of abnormal T2 signal hyperintensity within the peri-atrial white matter and posterior limb of the right internal capsule consistent with post treatment leukoencephalopathy (B, arrows). Note the resultant Wallerian degeneration within the right cerebral peduncle (C, arrow).
Figure 3
Figure 3
MR from Case 1 obtained 3.5 years following treatment. Axial T1 post contrast MR (A) shows no evidence of enhancement within the areas of prior PTLD within the right thalamus (A, arrow). Axial T2 W MR images (B, C) demonstrate interval development of abnormal T2 signal hyperintensity within the peri-atrial white matter and posterior limb of the right internal capsule consistent with post treatment leukoencephalopathy (B, arrows). Note the resultant Wallerian degeneration within the right cerebral peduncle (C, arrow).
Figure 4
Figure 4
MR examination from Case 2 at the time of initial presentation. Axial T1 post contrast (A,B), axial T2 (C) and axial T2* (D) weighted MR images of the brain demonstrate four of the patient's enhancing intraparenchymal masses. The largest is located within the right parietal lobe and demonstrates peripheral enhancement (A, arrow). Additional smaller lesions are noted within the left temporal lobe (B, long arrow), left thalamus (B, short arrow) and left caudate (B, dashed arrow). The right dominant parietal lobe mass is slightly hyperintense on T2 (C, long arrow) with associated petechial hemorrhage noted on T2* (D, arrows). Note the extensive associated vasogenic edema surrounding the dominant lesion on T2 imaging (C, short arrow).
Figure 4
Figure 4
MR examination from Case 2 at the time of initial presentation. Axial T1 post contrast (A,B), axial T2 (C) and axial T2* (D) weighted MR images of the brain demonstrate four of the patient's enhancing intraparenchymal masses. The largest is located within the right parietal lobe and demonstrates peripheral enhancement (A, arrow). Additional smaller lesions are noted within the left temporal lobe (B, long arrow), left thalamus (B, short arrow) and left caudate (B, dashed arrow). The right dominant parietal lobe mass is slightly hyperintense on T2 (C, long arrow) with associated petechial hemorrhage noted on T2* (D, arrows). Note the extensive associated vasogenic edema surrounding the dominant lesion on T2 imaging (C, short arrow).

Similar articles

Cited by

References

    1. Penn I, Porat G. Central nervous system lymphomas in organ allograft recipients. Transplantation. 1995 Jan 27;59(2):240–244. - PubMed
    1. Castellano-Sanchez AA, Li S, Qian J, Lagoo A, Weir E, Brat DJ. Primary central nervous system posttransplant lymphoproliferative disorders. Am J Clin Pathol. 2004 Feb;121(2):246–253. - PubMed
    1. Gallardo D, Ferra C, Berlanga JJ, et al. Neurologic complications after allogeneic bone marrow transplantation. Bone Marrow Transplant. 1996 Dec;18(6):1135–1139. - PubMed
    1. Jamali FR, Otrock ZK, Soweid AM, et al. An overview of the pathogenesis and natural history of post-transplant T-cell lymphoma (corrected and republished article originally printed in Leukemia & Lymphoma, June 2007; 48(6): 1237 - 1241) Leuk Lymphoma. 2007 Sep;48(9):1780–1784. - PubMed
    1. Kim IY, Jung S, Jung TY, Kang SS, Choi C. Primary central nervous system lymphoma presenting as an acute massive intracerebral hemorrhage: case report with immunohistochemical study. Surg Neurol. 2008 Sep;70(3):308–311. - PubMed

Publication types

MeSH terms