. 2013 Jul;16(7):974-81.
doi: 10.1038/nn.3402. Epub 2013 May 19.

A functional and perceptual signature of the second visual area in primates

Affiliations

A functional and perceptual signature of the second visual area in primates

Jeremy Freeman et al. Nat Neurosci. 2013 Jul.

Abstract

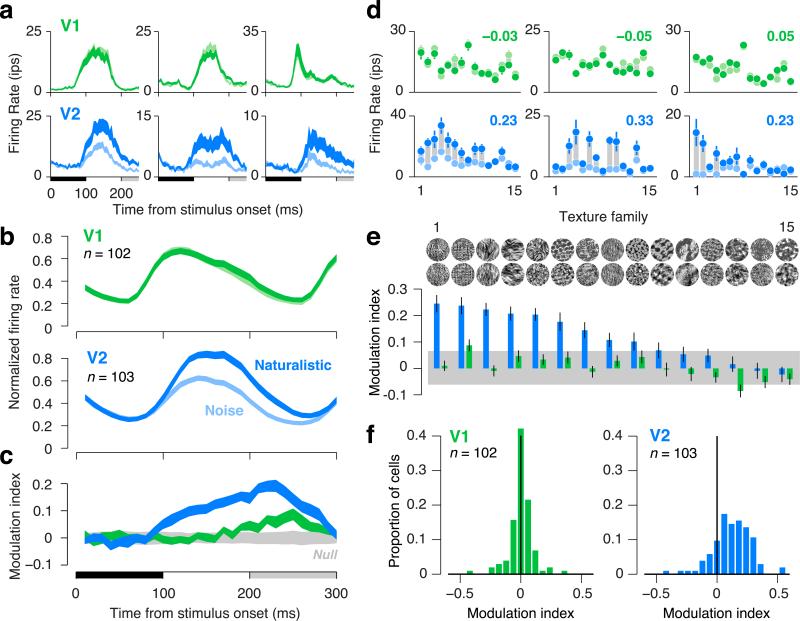
There is no generally accepted account of the function of the second visual cortical area (V2), partly because no simple response properties robustly distinguish V2 neurons from those in primary visual cortex (V1). We constructed synthetic stimuli replicating the higher-order statistical dependencies found in natural texture images and used them to stimulate macaque V1 and V2 neurons. Most V2 cells responded more vigorously to these textures than to control stimuli lacking naturalistic structure; V1 cells did not. Functional magnetic resonance imaging (fMRI) measurements in humans revealed differences between V1 and V2 that paralleled the neuronal measurements. The ability of human observers to detect naturalistic structure in different types of texture was well predicted by the strength of neuronal and fMRI responses in V2 but not in V1. Together, these results reveal a particular functional role for V2 in the representation of natural image structure.


Figures

Figure 1
Figure 1
Analysis and synthesis of naturalistic textures. (a) Original texture photographs. (b) Spectrally-matched noise images. The original texture is analyzed with linear filters and energy filters (akin to V1 simple and complex cells, respectively) tuned to different orientations, spatial frequencies, and spatial positions. Noise images contain the same spatially-averaged orientation and frequency structure of the original, but lack many of the more complex features. (c) Naturalistic texture images. Correlations are computed by taking products of linear and energy filter responses across different orientations, spatial frequencies, and positions. Images are synthesized to match both the spatially-averaged filter responses and the spatially-averaged correlations between filter responses. The resulting texture images contain many more of the naturalistic features of the original. See more examples in Supplementary Figure 1. (d) Synthesis of naturalistic textures begins with Gaussian white noise, and the noise is iteratively adjusted using gradient descent until analysis of the synthetic image matches analysis of the original (see Portilla & Simoncelli, 2001). Initializing with different samples of Gaussian noise yields distinct but statistically-similar images.
Figure 2
Figure 2
Neuronal responses to naturalistic textures differentiate V2 from V1 in macaques. (a) Time course of firing rate for three single units in V1 (green) and V2 (blue) to images of naturalistic texture (dark) and spectrally-matched noise (light). Thickness of lines indicates s.e.m. across texture families. Black horizontal bar indicates the presentation of the stimulus; gray bar indicates the presentation of the subsequent stimulus. (b) Time course of firing rate averaged across neurons in V1 and V2. Each neuron's firing rate was normalized by its maximum before averaging. Thickness of lines indicates s.e.m. across neurons. (c) Modulation index, computed as the difference between the response to naturalistic and the response to noise, divided by the sum. Modulation was computed separately for each neuron and texture family, then averaged across all neurons and families. Thickness of blue and green lines indicates s.e.m. across neurons. Thickness of gray shaded region indicates the 2.5th and 97.5th percentiles of the null distribution of modulation expected at each time point due to chance. (d) Firing rates for three single units in V1 (green) and V2 (blue) to naturalistic (dark dots) and noise (light dots), separately for the 15 texture families. Families are sorted according to the ranking in panel e. Gray bars connecting points are only for visualization of the differential response. Modulation indices (averaged across texture families) are reported in the upper right of each panel. Error bars indicate s.e.m. across the 15 samples of each texture family. (e) Diversity in modulation across texture families, averaged across all neurons. Error bars indicate s.e.m. across neurons. Gray bar indicates 2.5th and 97.5th percentiles of the null distribution of modulation expected due to chance. (f) Distributions of modulation indices across single neurons in V1 and V2. For each neuron, the modulation index for each texture family was computed on firing rates averaged within an 100 ms window following response onset, and modulation was then averaged across families.
Figure 3
Figure 3
Receptive field size does not explain differential responses to naturalistic texture stimuli in V2. (a,c) V2 neurons (blue). (b,d) V1 neurons (green). (a,b) Modulation index (difference in response to naturalistic and noise stimuli, divided by the sum) measured using stimuli presented within a 4° aperture (ordinate) versus classical receptive field size (abscissa). Each data point represents a neuron. There was no evidence for a relationship between modulation index and classical receptive field size in either V1 or V2. (c,d) Comparison of modulation indices measured using stimuli presented in an aperture matched in size to the classical receptive field (ordinate) versus indices measured using stimuli presented within a 4° aperture (abscissa). Each data point represents a neuron. Diagonal dashed line is the line of equality. Modulation in V1 was near 0 for both stimulus sizes. Modulation in V2 was positive for both stimulus sizes, but there was significantly less modulation in V2 for the smaller size.
Figure 4
Figure 4
fMRI responses to naturalistic textures differentiate V2 from V1 in humans. (a) Responses to alternating blocks of naturalistic texture images and spectrally-matched noise shown on a flattened representation of the occipital pole. Color indicates coherence, which captures the extent to which the fMRI responses to naturalistic and noise stimuli differ, computed voxel by voxel after averaging responses to all texture families. White lines indicate boundaries between visual areas identified in an independent retinotopic mapping experiment. (b) A measure of fMRI modulation (see Methods) averaged across voxels and texture families in V1 and V2 for three subjects. Error bars indicate s.e.m. across texture families. (c) Responses from an example subject to two individual texture families, only one of which evoked robust differential responses in V2. Same format as panel a. (d) Correlation between fMRI and single-unit modulation for V1 (green) and V2 (blue). Each data point represents a different texture family.
Figure 5
Figure 5
Neuronal responses to naturalistic textures in V2 predict perceptual sensitivity. (a) Stimuli were generated along an axis of “naturalness” by gradually introducing higher-order correlations (Fig. 1b). (b) Observers performed a 3AFC “oddity” task in which they viewed three images, two naturalistic and one noise (or vice versa), and indicated which looked different from the other two. All three images were synthesized independently (e.g., starting with statistically independent samples of Gaussian white noise). (c) Psychometric function: performance as a function of naturalness. Solid curves, best-fit cumulative Weibull function. Chance performance is 1/3. The two panels show two different texture families (same as in Fig. 4c) with different thresholds (defined as the level of naturalness required to obtain ~75% correct). (d) Correlation between psychophysical sensitivity (1/threshold) and single-unit modulation in V1 (green) and V2 (blue). Each data point represents a texture family. (e) Correlation between psychophysical sensitivity and fMRI modulation. Same format as panel d.
Figure 6
Figure 6
Crowdsourced psychophysical estimates of sensitivity for hundreds of texture families. (a) Example psychometric functions for two texture families (same as Fig. 4c and 5c), each based on observers recruited from Amazon.com's Mechanical Turk performing a 3AFC task in a web browser. Each colored line corresponds to one observer. The black line indicates the best-fitting psychometric function, estimated using a mixture model that re-weighted observers based on their reliability (see Supplementary Analysis); thickness of the colored lines indicates the weight assigned to each observer. Chance performance is 1/3. (b) Perceptual sensitivity (1/threshold) was significantly correlated when measured in the laboratory (abscissa) and in the crowd (ordinate). Dashed line is the line of equality. (c) The distribution of perceptual sensitivities across 494 texture families was used to pick 20 families spanning the range of sensitivities, emphasizing the extremes (light gray regions). (d) Correlations between single-unit modulation and sensitivity (measured in the crowd) for the chosen families, in V1 (green) and V2 (blue). Only 17 of the 20 families were included due to experimental time constraints. (e) Correlations between fMRI modulation and sensitivity. All 20 families were included. Same format as panel d.
Figure 7
Figure 7
Using higher-order correlations to predict perceptual sensitivity. (a) Cross-scale, cross-position, and cross-orientation correlations are computed by taking products of localized V1-like filter responses. Each circle represents an image location. Filters at each location are tuned to orientation and frequency, and compute either linear or energy responses (see panel b). (b) Linear filters are sensitive to phase, akin to V1 simple cells; energy filters compute the square root of the sum of squared responses of two phase-shifted filters (in quadrature pair) and are thus insensitive to phase, akin to V1 complex cells (Adelson & Bergen, 1985). For both filter types, products (as in panel a) are averaged across spatial locations to yield correlations. (c) We used multiple linear regression to predict perceptual sensitivity to naturalistic textures based on higher-order correlations and other image statistics used in texture synthesis. Each data point corresponds to a texture family; black dots indicate all texture families used in physiological experiments (from Figs. 2e, 5de, 6de). Black dashed line is the line of equality. (d) Wedges indicate the fractional R2 assigned to each group of texture synthesis parameters from the regression analysis. See Portilla & Simoncelli (2001) and Balas (2008) for example images demonstrating the role of some of these parameters in texture synthesis.

References

    1. Schiller PH, Malpeli JG. The effect of striate cortex cooling on area 18 cells in the monkey. Brain Research. 1977;126:366–369. - PubMed
    1. Sincich LC, Horton JC. The circuitry of V1 and V2: integration of color, form, and motion. Annual Review of Neuroscience. 2005;28:303–326. - PubMed
    1. Peterhans E, Heydt RVD. Mechanisms of contour perception in monkey visual cortex. II. Contours bridging gaps. Journal of Neuroscience. 1989;9:1749–1763. - PMC - PubMed
    1. Hegdé J, Essen DCV. Selectivity for complex shapes in primate visual area V2. Journal of Neuroscience. 2000;20:1–6. - PMC - PubMed
    1. Hegdé J, Essen DCV. A comparative study of shape representation in macaque visual areas v2 and v4. Cerebral Cortex. 2007;17:1100–1116. - PubMed

Publication types

MeSH terms