. 2013 Jul;45(7):756-66.
doi: 10.1038/ng.2641. Epub 2013 May 19.

Forward genetic screen for malignant peripheral nerve sheath tumor formation identifies new genes and pathways driving tumorigenesis

Affiliations

Forward genetic screen for malignant peripheral nerve sheath tumor formation identifies new genes and pathways driving tumorigenesis

Eric P Rahrmann et al. Nat Genet. 2013 Jul.

Abstract

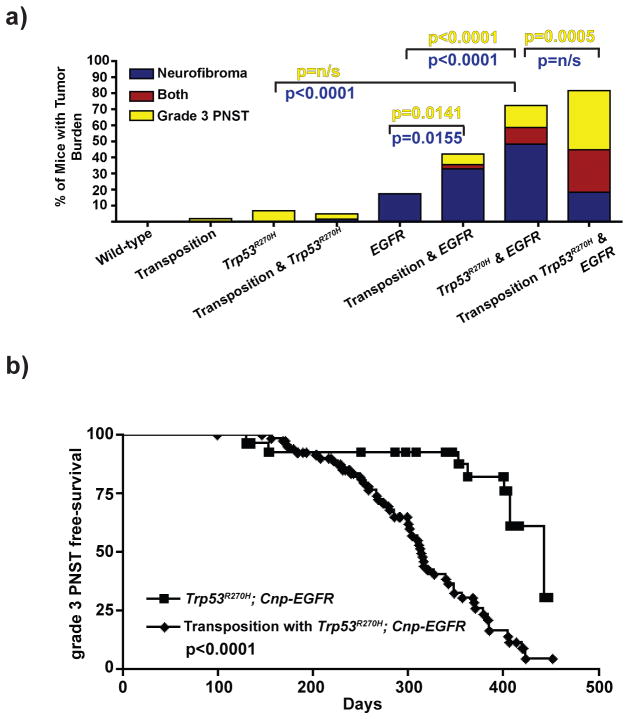
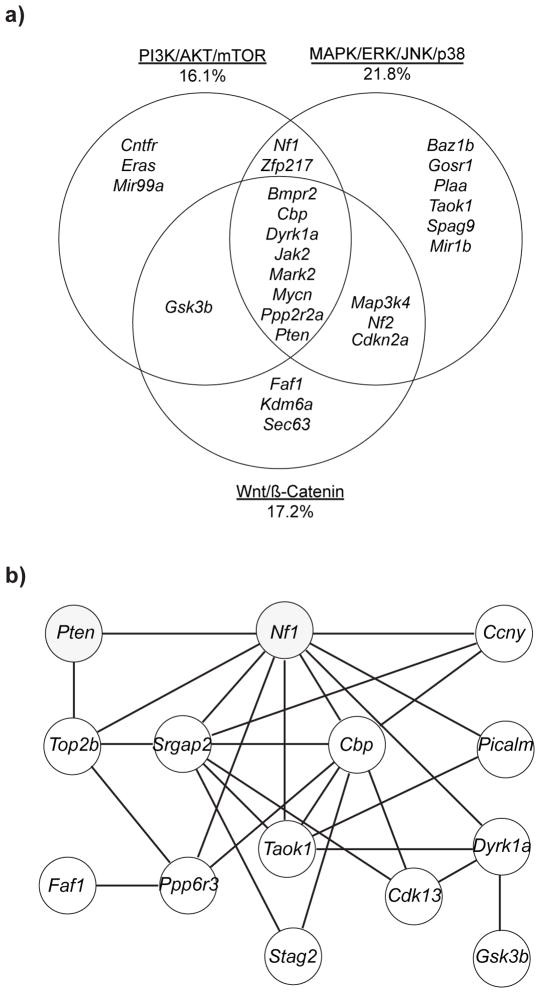
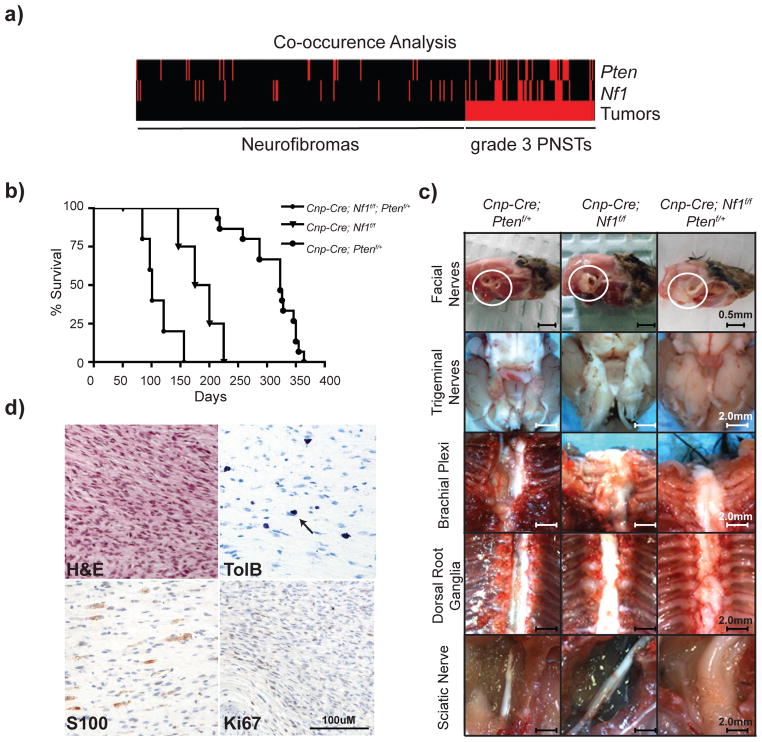
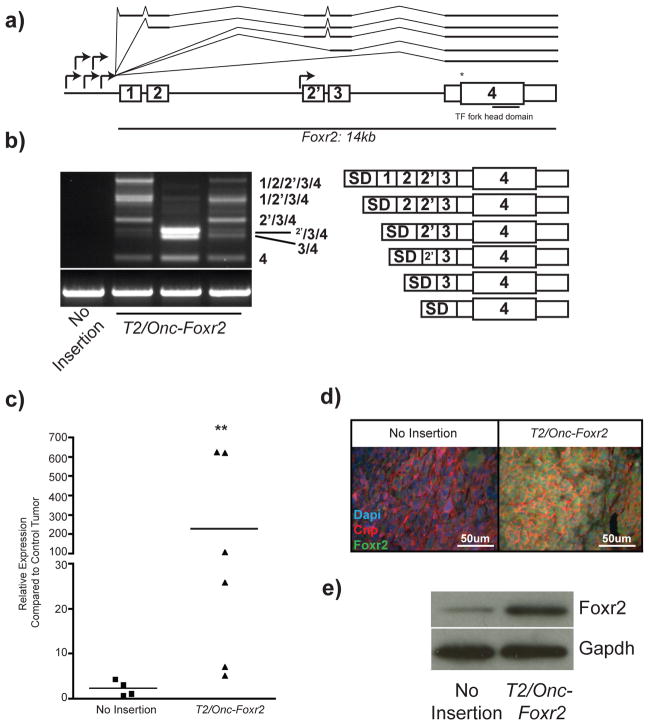
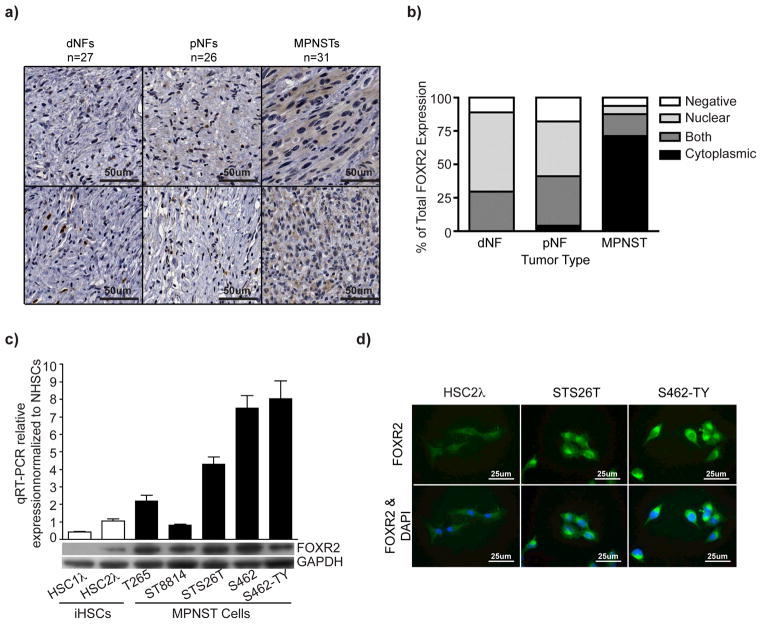
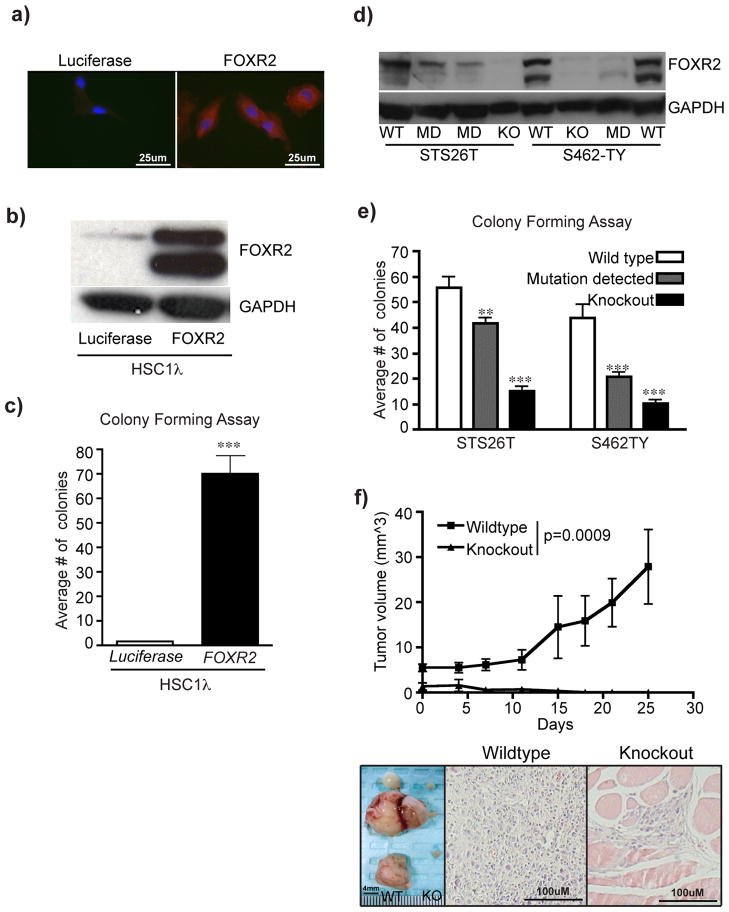
Malignant peripheral nerve sheath tumors (MPNSTs) are sarcomas of Schwann cell lineage origin that occur sporadically or in association with the inherited syndrome neurofibromatosis type 1. To identify genetic drivers of MPNST development, we used the Sleeping Beauty (SB) transposon-based somatic mutagenesis system in mice with somatic loss of transformation-related protein p53 (Trp53) function and/or overexpression of human epidermal growth factor receptor (EGFR). Common insertion site (CIS) analysis of 269 neurofibromas and 106 MPNSTs identified 695 and 87 sites with a statistically significant number of recurrent transposon insertions, respectively. Comparison to human data sets identified new and known driver genes for MPNST formation at these sites. Pairwise co-occurrence analysis of CIS-associated genes identified many cooperating mutations that are enriched in Wnt/β-catenin, PI3K-AKT-mTOR and growth factor receptor signaling pathways. Lastly, we identified several new proto-oncogenes, including Foxr2 (encoding forkhead box R2), which we functionally validated as a proto-oncogene involved in MPNST maintenance.


Conflict of interest statement

COMPETING FINANCIAL INTERESTS

D.A. Largaespada has ownership interest (including patents) in Discovery Genomics, Inc. and NeoClone Biotechnologies International. He is also a consultant/Advisory Board member of Discovery Genomics, Inc. and NeoClone Biotechnologies International.

Figures

Figure 1
Figure 1. SB mutagenesis induced and accelerated grade 3 PNST formation
(a) Bar graph depicting the percentage of mice that developed each tumor type at the time of necropsy based on genotype. p-values reflect FET. (b) Survival curve depicting incidence of grade 3 tumor formation in Trp53R270H; Cnp-EGFR control mice compared to mice undergoing transposition with Trp53R270H; Cnp-EGFR background. Median age of tumor-free survival was 313 days (n=87) with transposition compared to 443 days (n=29) in the control. Log rank test: p<0.0001.
Figure 2
Figure 2. Comparative analysis of grade 3 PNST CISs to human MPNSTs
CNA, methylome, and microarray expression data from human MPNST data (Supplementary Fig. 6–8, Supplementary Tables 3,5) were combined into a “bubble plot”. The y-axis displays the methylation state (negative number indicating hypomethylation and positive number indicating hypermethylation) of each gene’s CpG-IS nearest to the transcriptional start site (TSS) in MPNSTs versus NHSCs (methylation analysis described in detail in online methods and Supp Table 5). The x-axis depicts the CNA observed in MPNSTs versus NHSCs (determination of CNA is described in online methods and Supp Table 3). Numbers reflect the percentage of the 51 patient samples that have a CNA. Negative numbers indicated CNA loss while positive numbers indicate CNA gains. The yellow shaded area indicates the 95th percentile for significant recurrent CNAs. Microarray expression was represented by size from 1X-10X (determination of expression changes are described in online methods and Supp Fig 8) and color to depict genes that are upregulated in red (a), downregulated in blue (b), or have no change or have no probes on the microarray in gray (c) in gene expression comparing MPNSTs to NHSCs. For recurrent CNAs, we considered a gene that shows the gain (or loss) pattern if the ratio of gain (or loss) out of all 51 patients is more than 1.5X that of the ratio of loss (or gain). Significant recurrent CNAs must be observed in 23/51 patient samples (95th percentile).
Figure 3
Figure 3. CIS analysis for cooperating genes and pathways for grade 3 PNST formation
(a) Venn diagram depicting the clustering of the 87 grade 3 PNST CISs into three cancer-associated signaling pathways: PI3K/AKT/mTOR, MAPK/ERK/p38, Wnt/CTNNB1. Values indicate the percentage of the 87 CISs contributing to each pathway. CISs were classified into each pathway based on IPA, DAVID, GENECARD, and PUBMED analysis and literature review to identify canonical members and pathway effectors. (b) This module of genes depicts co-occurrence analysis of grade 3 PNST td-CISs. p-values for CIS interactions are listed in Supplementary Table 10.
Figure 4
Figure 4. Loss of Nf1 and Pten cooperate to form high-grade PNSTs
(a) Co-occurrence analysis heat map depicting each mouse tumor (neurofibromas left, grade 3 PNST right) and the presence of an insertion into either the Pten or the Nf1 locus (red bars). Tumors from 13/62 mice (106 grade 3 PNSTS) contained insertions in both Nf1 and Pten, which is statistically significantly different from the neurofibroma profile of 1/55 mice (269 neurofibromas) (FET p<7.94x10−05). (b) Survival curve of three genetic cohorts: Cnp-Cre; Nf1f/f; Ptenf/+(n=5), Cnp-Cre; Nf1f/f (n=5), Cnp-Cre; Ptenf/+(n=15). Statistical analysis of curves: Cnp-Cre; Nf1f/f; Ptenf/+ vs Cnp-Cre; Nf1f/f p<0.05; Cnp-Cre; Nf1f/f; Ptenf/+ vs Cnp-Cre; Ptenf/+p<0.0001; Cnp-Cre; Nf1f/f vs Cnp-Cre; Ptenf/+p=0.0018. p-values reflect Logrank test. (c) Necropsy images from a 275 day old Cnp-Cre; Ptenf/+mouse, a 175 day old Cnp-Cre; Nf1f/f mouse, and a 120 day old Cnp-Cre; Nf1f/f; Ptenf/+mouse. (d) Histological analysis of sciatic nerve tumor in (c). H&E staining depicts high cellularity with few mitotic figures corroborated with Ki67 IHC. Toluidine blue stain depicts presence of Mast cells indicative of nerve origin. S100 positive staining depicts presence of Schwann cells. This tumor contained regions of high-grade PNST formation.
Figure 5
Figure 5. T2/Onc insertions in the Foxr2 locus cause overexpression of Foxr2 in SB-derived grade 3 PNSTs
(a) Schematic depicting the mouse Foxr2 locus. The MSCV promoter of T2/Onc for all transposon insertions faces the same orientation as Foxr2 transcription (arrows). Annotated exons are marked as 1, 2, 3, 4. * represents the translational start site. The exon 2′ is a putative unannotated exon. (b) RT-PCR on cDNA from SB-derived grade 3 PNSTs. Bands indicate mRNA fusions between T2/Onc and Foxr2. Lane 1 is an SB-derived grade 3 PNST that did not contain a Foxr2 insertion. Lanes 2 and 4 are T2/Onc insertions upstream of exon 1. Lane 3 is the T2/Onc insertion immediately upstream of exon 2′. The schematics are the sequenced splicing events from each of the excised products. The superscript 2′ represents splicing into the putative 2′ exon. (c) Quantitative PCR for Foxr2 expression in SB-derived grade 3 PNSTs with and without a T2/Onc insertion in Foxr2. ** p<0.001 based on two-tailed student t-test. (d) Immunofluorescent staining for Foxr2 (green), Cnp (red), and Dapi (blue) on tumor sections containing (right) and not containing (left) a T2/Onc insertion in Foxr2. (e) Western blot analysis for Foxr2 expression from two SB-derived tumor cell lines containing (right) and not containing (left) a T2/Onc insertion into Foxr2.
Figure 6
Figure 6. Increased FOXR2 expression is associated with human MPNSTs
(a) Immunohistochemical staining for FOXR2 of a tissue microarray (TMA) containing 27 dermal neurofibroma samples (dNF), 26 plexiform neurofibroma samples (pNF), and 31 MPNST samples. Representative images for FOXR2 staining for each tumor type are shown. (b) Bar graph depicts percentages for either staining localization for each tumor type (nuclear, cytoplasmic, both, or negative). (c) The bar graph depicts quantitative PCR analysis for FOXR2 expression in iHSCs (HSC1λ and HSC2λ) and MPNST (T265, ST8814, STS26T, S462, S462-TY) cell lines. Data are normalized to purified normal human Schwann cells (NHSCs). The lower bands indicate western blot analysis for FOXR2 for the same cell lines. (d) Immunofluorescent imaging of FOXR2 expression in HSC2λ, STS26T, and S462-TY. Staining is predominantly cytoplasmic as observed in the MPNST samples in (a).
Figure 7
Figure 7. Modulating FOXR2 expression significantly alters MPNST tumorigenic properties
(a) Immunofluorescent imaging of FOXR2 expression in HSC1λ targeted with either a Luciferase expression construct (left) or a FOXR2 expression construct (right). (b) FOXR2 western blot on cells from (a). (c) Bar graph depicts results from a soft-agar colony-forming assay performed in triplicate. Statistical analysis was done using a two-tailed student t-test, *** p<0.0001 (d) Western blot analysis of FOXR2 expression on STS26T and S462-TY cell lines targeted with FOXR2 TALENs. WT = wildtype, KO = knockout, MD = mutation detected. (e) Bar graph depicts results from a soft agar colony-forming assay performed in triplicate with biological replicate cell lines. STS26T wildtype (n= 3), STS26T mutation detected (n=4), STS26T knockout (n=4), S462-TY wildtype (n=2), S462-TY mutation detected (n=4 ), and S462-TY knockout (n=4). Statistics were done using a two-tailed student t-test comparing to the respective wildtype control. **p-=0.0032, ***p<0.0001. (f) One million STS26T wildtype (n=8, left flank) and STS26T FOXR2 KO (n=8, right flank) cells were injected into Nu/Nu mice. Tumors were measured over a 1 month period. Wildtype STS26T tumors grew significantly larger than paired KO (two-tailed student t-test ***p=0.0009). Images were captured at time of necropsy of the tumors from WT (n=5, left) or regions were injections occurred (n=5, right). H&E staining of tissue sections from the masses indicate the wildtype masses were tumors while the masses from the KO cells were predominantly fat pad tissue that contained the injected cells.

Similar articles

Cited by

References

    1. Ducatman BS, Scheithauer BW, Piepgras DG, Reiman HM, Ilstrup DM. Malignant peripheral nerve sheath tumors. A clinicopathologic study of 120 cases. Cancer. 1986;57:2006–21. - PubMed
    1. Evans DG, et al. Malignant peripheral nerve sheath tumours in neurofibromatosis 1. Journal of medical genetics. 2002;39:311–4. - PMC - PubMed
    1. Watson MA, et al. Gene Expression Profiling Reveals Unique Molecular Subtypes of Neurofibromatosis Type I-associated and Sporadic Malignant Peripheral Nerve Sheath Tumors. Brain pathology. 2004;14:297–303. - PMC - PubMed
    1. Holtkamp N, et al. Subclassification of nerve sheath tumors by gene expression profiling. Brain pathology. 2004;14:258–264. - PMC - PubMed
    1. Miller SJ, et al. Large-scale molecular comparison of human schwann cells to malignant peripheral nerve sheath tumor cell lines and tissues. Cancer Res. 2006;66:2584. - PubMed

Publication types

Associated data