. 2013 Jun;19(6):704-12.
doi: 10.1038/nm.3143. Epub 2013 May 19.

Inhibition of TGF-β signaling in mesenchymal stem cells of subchondral bone attenuates osteoarthritis

Affiliations

Inhibition of TGF-β signaling in mesenchymal stem cells of subchondral bone attenuates osteoarthritis

Gehua Zhen et al. Nat Med. 2013 Jun.

Abstract

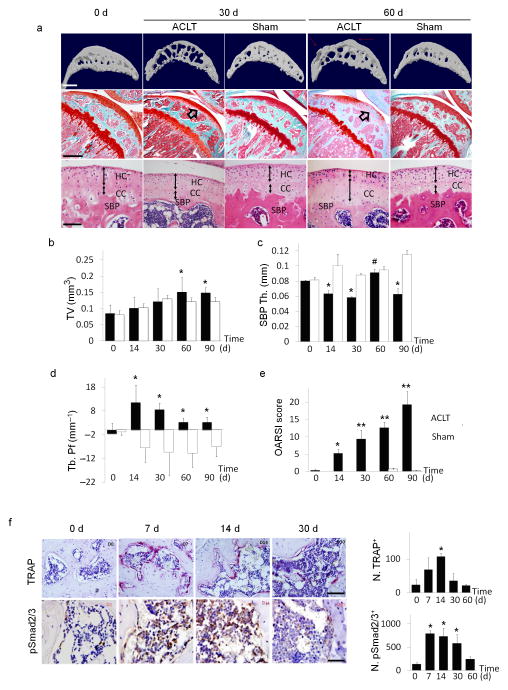
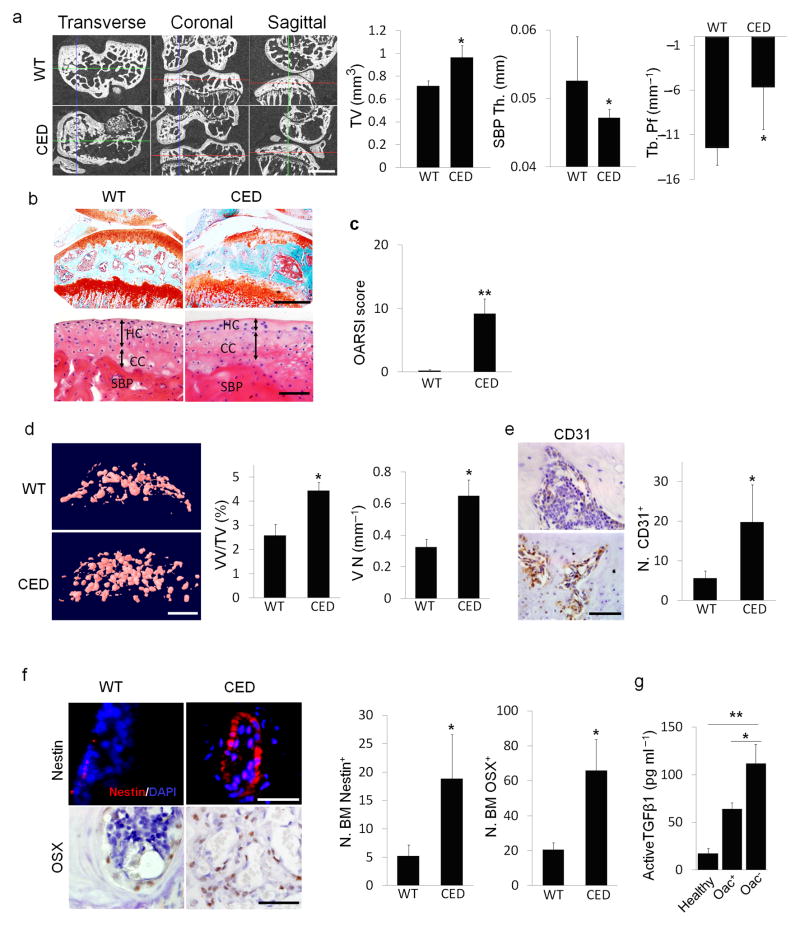
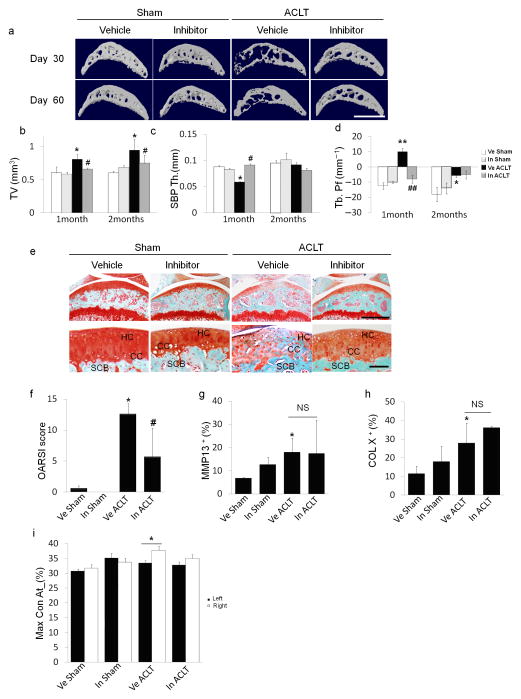
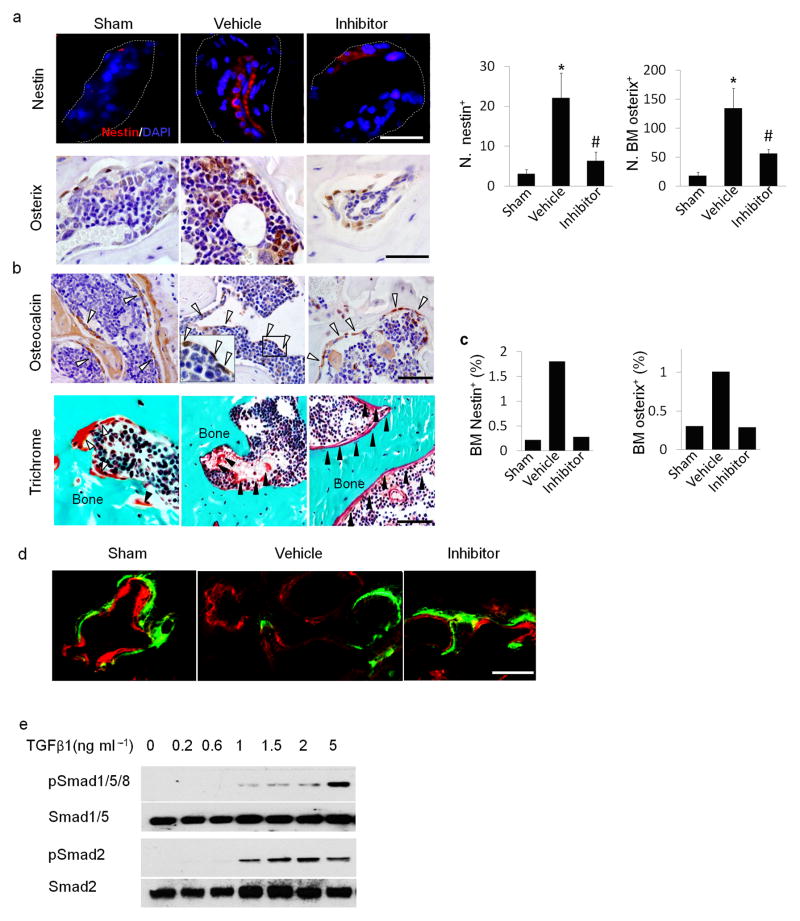
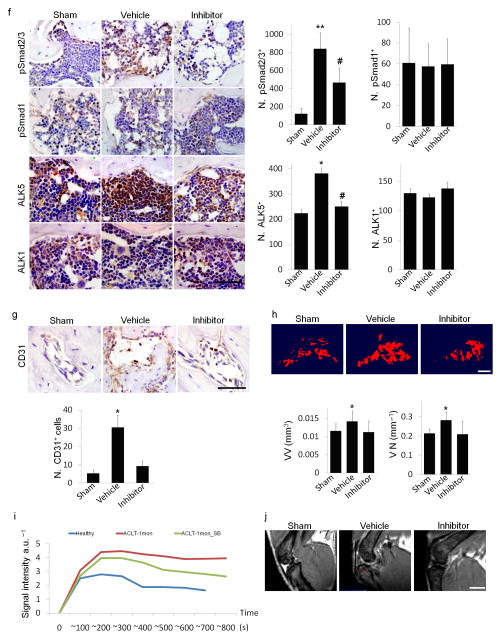
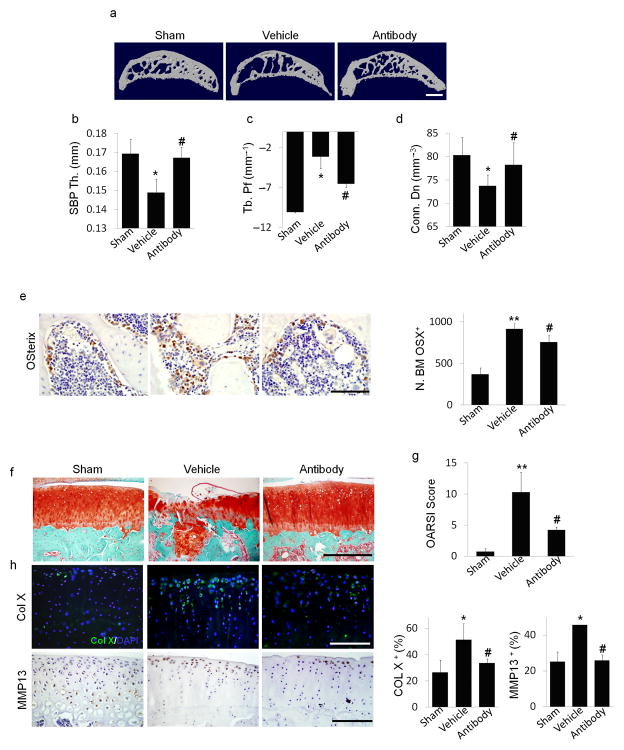
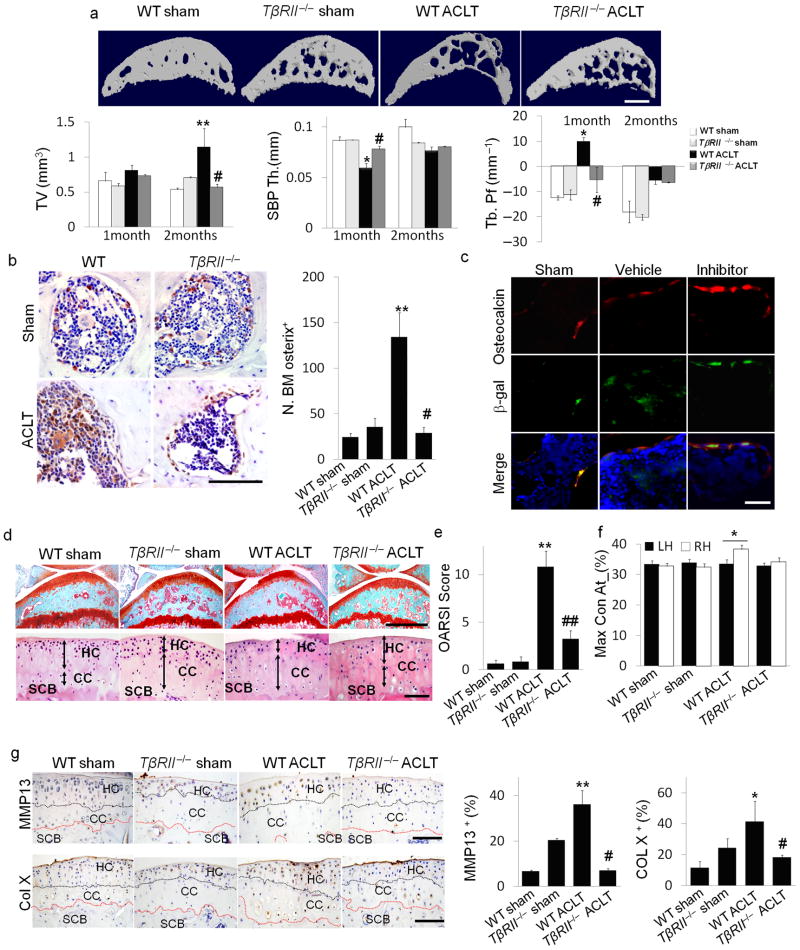
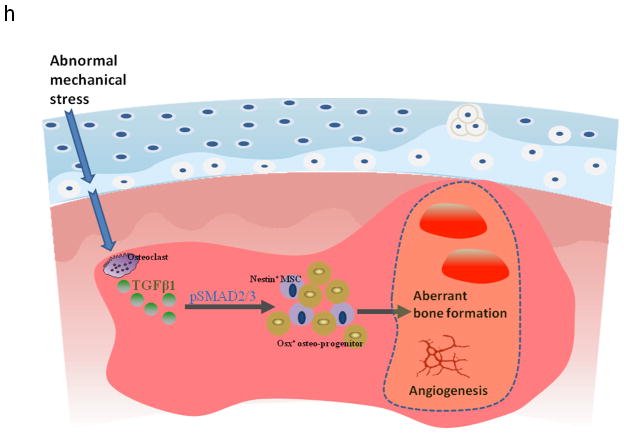
Osteoarthritis is a highly prevalent and debilitating joint disorder. There is no effective medical therapy for the condition because of limited understanding of its pathogenesis. We show that transforming growth factor β1 (TGF-β1) is activated in subchondral bone in response to altered mechanical loading in an anterior cruciate ligament transection (ACLT) mouse model of osteoarthritis. TGF-β1 concentrations are also high in subchondral bone from humans with osteoarthritis. High concentrations of TGF-β1 induced formation of nestin-positive mesenchymal stem cell (MSC) clusters, leading to formation of marrow osteoid islets accompanied by high levels of angiogenesis. We found that transgenic expression of active TGF-β1 in osteoblastic cells induced osteoarthritis, whereas inhibition of TGF-β activity in subchondral bone attenuated the degeneration of articular cartilage. In particular, knockout of the TGF-β type II receptor (TβRII) in nestin-positive MSCs led to less development of osteoarthritis relative to wild-type mice after ACLT. Thus, high concentrations of active TGF-β1 in subchondral bone seem to initiate the pathological changes of osteoarthritis, and inhibition of this process could be a potential therapeutic approach to treating this disease.


Figures

Figure 1
Figure 1. Upregulated TGF–β signaling in the subchondral bone is associated with changes of subchondral bone architecture in ACLT mice
(a(top)) Three–dimensional high–resolution μCT images of tibial subchondral bone medial compartment (sagittal view) at 0, 30, or 60 days post sham or ACLT surgery. Altered morphology of subchondral bone plate is indicated by red arrows. Scale bar, 500 μm. (a(center)) Sanfranin O–Fast green staining of sagittal sections of tibia medial compartment, proteoglycan (red) and bone (green). Arrows indicate loss of proteoglycan at 30 and 60 days post–surgery. Scale bar, 500 μm. (a(bottom) H&E staining of subchondral bone plate (SBP) and cartilage. Hyaline cartilage (HC) and calcified cartilage (CC) thickness are indicated by double arrowed lines. Scale bar, 100 μm. (b–d) Quantitative analysis of structural parameters of subchondral bone byμCT analysis: total tissue volume (TV), thickness of subchondral bone plates (SBP Th) and trabecular pattern factor (Tb. Pf). n = 8; *P < 0.05 vs. sham group at corresponding time points; #P < 0.05 vs. ACLT group at 30 days post–surgery. (e) OARSI scores at 0–90 days post surgery. n = 8; *P < 0.05 and **P < 0.01 vs. Day 0 group. (f) TRAP staining (pink, top), scale bar, 200 μm and immunohistochemical analysis of pSmad2/3+ cells (brown, bottom), scale bar, 100 μm in mouse tibial subchondral bone after ACLT surgery. Quantitative analysis of TRAP+ or p–Smad2/3+ cells per bone marrow area (mm2), reported as mean ± SD. n = 8; *P < 0.05 vs. Day 0 group.
Figure 2
Figure 2. CED mice with transgenic activating mutation of TGF–β1 demonstrates knee OA phenotype
(a) μCT images of transverse, coronal and sagittal views of tibia subchondral bone of 4 month old CED mice vs. wild–type (WT) littermates. Scale bar, 1mm, with quantitative analysis of structural parameters of subchondral bone: total tissue volume (TV), thickness of subchondral bone plates (SBP Th) and trabecular pattern factor (Tb. Pf). (b) Sanfranin O–Fast green, scale bar, 500 μm(top) and H&E staining of sagittal sections of tibia medial compartment, scale bar, 100 μm(bottom). Double arrowed lines indicate hyaline cartilage (HC) and calcified cartilage (CC) thickness. Subchondral bone plate = SBP. (c) OARSI scores of CED vs. WT littermates. (d) CT–based micro-angiography of tibia subchondral bone of CED vs. WT littermates with quantification of vessel volume relative to tissue volume (VV/TV) and vessel number (VN). Scale bar, 500 μm. (e,f) Immunohistochemical or immunofluorescent analysis of CD31+ (brown), scale bar, 50 μm (e); nestin+ (red, top), scale bar, 50 μm; osterix+ (brown, bottom) cells, scale bar, 100 μm. DAPI stains nuclei (blue) (f(top)) in tibial subchondral bone of CED vs. WT littermates. (a–f) n = 10; *P < 0.05, **P < 0.01. (g) ELISA analysis of active TGF–β1 in condition medium of human tibia subchondral bone specimen. Healthy: subchondral bone collected from healthy donors, Oac+: OA subchondral bone with articular cartilage, Oac: OA subchondral bone without articular cartilage. n = 10; *P < 0.05; **P < 0.01. Data reported as mean ± SD.
Figure 3
Figure 3. TβRI inhibitor stabilized subchondral bone architecture and attenuated articular cartilage degeneration in ACLT mice
(a) Three–dimensional μCT images of tibia subchondral bone medial compartment (sagittal view) of mice treated with 1 mg kg−1 of TβRI inhibitor daily for 30 days and sacrificed 1 or 2 months post ACLT or sham surgery. Scale bar, 1 mm. (b–d) Quantitative analysis of structural parameters of subchondral bone by μCT analysis: tissue volume (TV), thickness of subchondral bone plate (SBP), and trabecular pattern factor (Tb. Pf). (e) Sanfranin O–fast green staining of articular cartilage in sagittal sections of tibia medial compartment from mice treated with vehicle or inhibitor for 1 month and sacrificed 2 months post ACLT or sham surgery. Scale bar, 500 μm (top) or 100 μm (bottom). (f) OARSI scores of sham or ACLT mice treated with either vehicle (Ve) or TβRI inhibitor (In). (g, h) Quantitative analysis of the percentage of MMP13+ and type X collagen+ chondrocytes in immunohistochemically stained articular cartilage tissue sections. (i) Maxcontactat(%) of the gait analysis in mice 2 months post ACLT or sham surgery treated with vehicle or inhibitor for 1 month. n = 8–12; *P < 0.05 **P < 0.01 vs. Ve Sham; #P < 0.05, ##P < 0.01 vs. Ve ACLT, NS: not significant. Data reported as mean ± SD.
Figure 4
Figure 4. TβRI inhibitor reduced uncoupled bone formation and angiogenesis in ACLT mice
(a) Immunofluorescent or immunohistochemical analysis and quantification of nestin (red) and osterix (brown) in tibial subchondral bone collected one month after sham operation treated with vehicle (Sham), ACLT operated treated with vehicle (Vehicle), or ACLT operated treated with TβRI inhibitor (Inhibitor). DAPI stains nuclei (blue) (top). Scale bars, 50 μm.(b) Immunohistochemical analysis of osteocalcin (brown) and trichrome staining in tibial subchondral bone sections. Scale bars, 50 μm. Open arrowheads indicating osteocalcin+ cells and close arrowheads indicating osteoid. (c) Flow cytometry analysis of nestin and osterix in bone marrow from mouse subchondral bone. (d) Calcein (green) and xylenol orange (orange) fluorescent double labeling. Scale bar, 100 μm. (e) Western blot analysis of pSmad1/5/8, Smad1/5, pSmad2 and Smad2 of in cultured MSCs treated with increasing doses of recombinant hTGF–β1 (f) Immunohistochemical analysis and quantification of pSmad2/3, pSmad1, ALK5 and ALK1 (all stained brown) in subchondral bone of the mice 2 weeks post surgery. Scale bar, 50 μm. (g) Immunohistochemical analysis and quantification of CD31 (brown) in subchondral bone. Scale bar, 50 μm. (h) CT–based micro–angiography of the tibia subchondral bone and quantification of subchondral bone vessel volume (VV) and vessel number (VN), Scale bar, 500μm. (i) Perfusion rate obtained via T2 weighted MRI scanning with contrast. (j) Representative MRI T1 weighted images. Red arrow indicates bone marrow lesion. n = 8–12; *P < 0.05 vs. sham; #P < 0.05 vs. vehicle.
Figure 5
Figure 5. Local subchondral administration of TGF–β antibody reduced abberant subchondral bone formation and articular cartilage degeneration in ACLT rats
(a) Three dimensional μCT images of tibia subchondral bone medial compartment (sagittal view) in rats that underwent sham (Sham) or ACLT surgery with implantation of an alginate bead containing either vehicle (Vehicle) or TGF–β antibody (Antibody) 3 months post surgery. Scale bar, 1 mm. (b–d) Quantitative analysis of structural parameters of subchondral bone by μCT analysis: thickness of subchondral bone plate (SBP), trabecular pattern factor (Tb. Pf) and connectivity density (Conn. Dn). (e) Immunohistochemical and quantitative analysis of osterix (brown). Scale bars, 100 μm. (f) Sanfranin O–fast green staining of sagittal sections of subchondral tibia medial compartment, scale bar, 400 μm. (g) OARSI scores. (h) Immunofluorescent or immunohistochemical and quantitative analysis of type X collagen (green,) and MMP13 (brown) in articular cartilage. DAPI stains nuclei (blue) (center). Scale bars, 200 μm. n = 8; *P < 0.05, **P < 0.01 vs. sham, #P < 0.05 vs. vehicle ACLT rats.
Figure 6
Figure 6. Inducible knockout of TβRII in nestin+ cells reduced the changes in subchondral bone and articular cartilage in ACLT mice
(a) Three–dimensional μCT images of tibia subchondral bone medial compartment (sagittal view) in wild–type (WT) or Nestin–CreTMER::TβRIIfl/fl (TβRII−/ −) mice 2 months after undergoing sham or ACLT surgery. Scale bar, 500 μm, and quantitative analysis of structural parameters of subchondral bone by μCT analysis: subchondral bone tissue volume (TV), thickness of subchondral bone plate (SBP), and trabecular pattern factor (Tb. Pf). (b) Immunohistochemical and quantitative analysis of osterix (brown). Scale bar, 100 μm. (c) Double–immunofluorescent analysis of osteocalcin (red) and β–gal (green) in subchondral bone of Nestin–CreTMER:: Rosa26–LacZfl/fl mice that underwent sham or ACLT operation and were treated with vehicle– or TβRI inhibitor. Scale bar, 40 μm. (d) Sanfranin O–fast green and H&E staining of the sagittal sections of tibia medial compartment. Scale bar, 100 μm. (e) OARSI scores. (f) Max_contact_at(%) of the gait analysis in mice. (g) Immunohistochemical and quantitative analysis of MMP13 and type X collagen (both stain brown). HC = hylane cartilage; CC = calcified cartilage; SCB = subchondral bone. n = 8; *P < 0.05, **P < 0.01 vs. wild type sham, #P < 0.05, ##P < 0.01 vs. wild type ACLT group. Scale bars, 100 μm. (h) Model of elevated active TGF–β1 in the subchondral bone at the onset of OA. TGF–β1 is activated in the subchondral bone in response to abnormal mechanical loading. The accumulated high concentrations of active TGF–β1 stimulate increases in MSCs and osteoprogenitors in the marrow, which lead to aberrant bone formation and angiogenesis for OA progression.

Comment in

References

    1. Hootman JM, Helmick CG. Projections of US prevalence of arthritis and associated activity limitations. Arthritis Rheum. 2006;54:226–229. - PubMed
    1. van den Berg WB. Osteoarthritis year 2010 in review: pathomechanisms. Osteoarthritis Cartilage. 2011;19:338–341. - PubMed
    1. Berenbaum F. Osteoarthritis year 2010 in review: pharmacological therapies. Osteoarthritis Cartilage. 2011;19:361–365. - PubMed
    1. Hawker GA, Mian S, Bednis K, Stanaitis I. Osteoarthritis year 2010 in review: non-pharmacologic therapy. Osteoarthritis Cartilage. 2011;19:366–374. - PubMed
    1. Saito T, et al. Transcriptional regulation of endochondral ossification by HIF-2alpha during skeletal growth and osteoarthritis development. Nat Med. 2010;16:678–686. - PubMed

Publication types

MeSH terms

Substances