

The role of peritoneal alternatively activated macrophages in the process of peritoneal fibrosis related to peritoneal dialysis
- PMID: 23685870
- PMCID: PMC3676844
- DOI: 10.3390/ijms140510369
The role of peritoneal alternatively activated macrophages in the process of peritoneal fibrosis related to peritoneal dialysis
Abstract
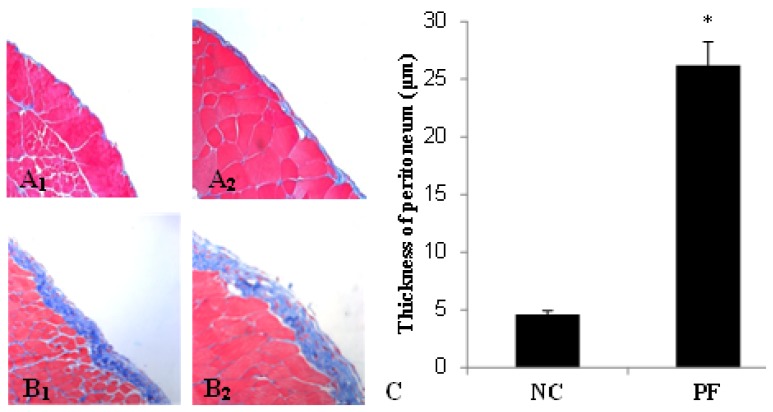
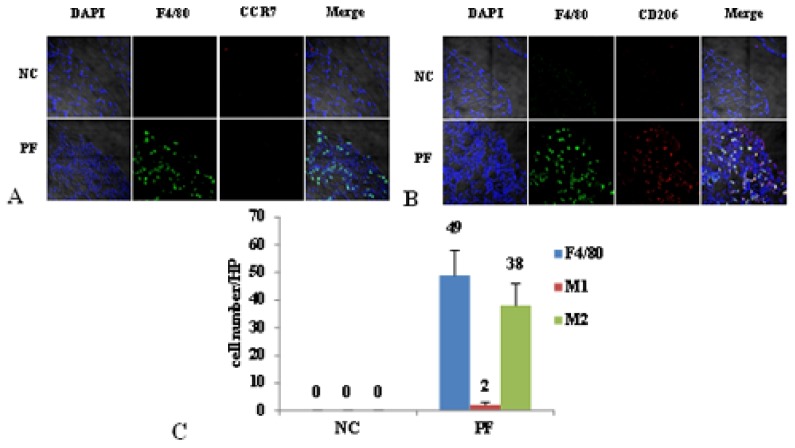
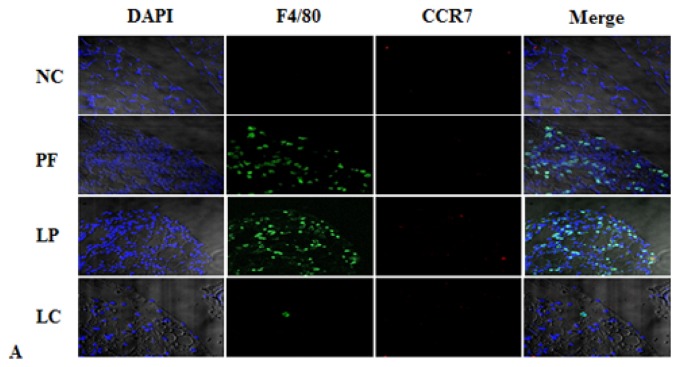
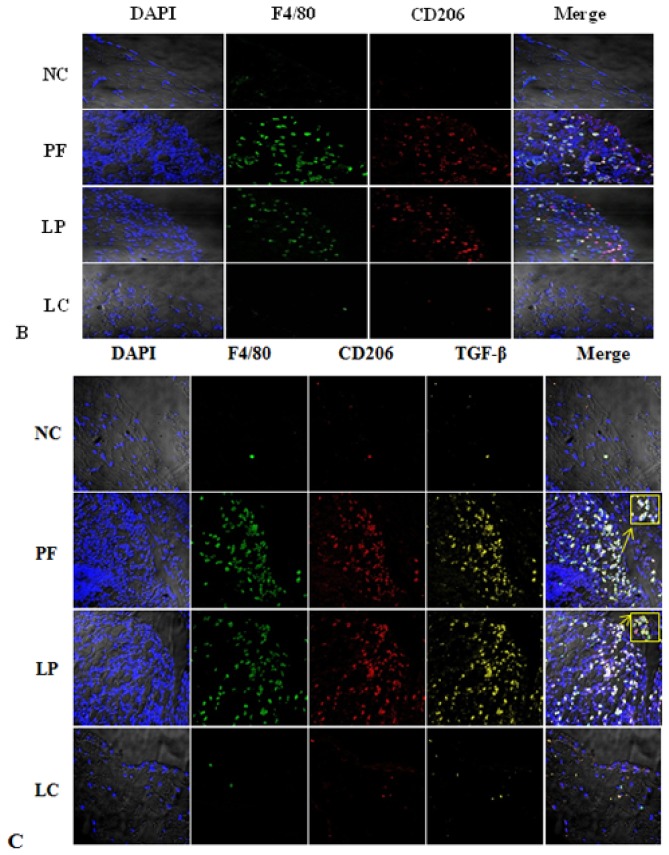
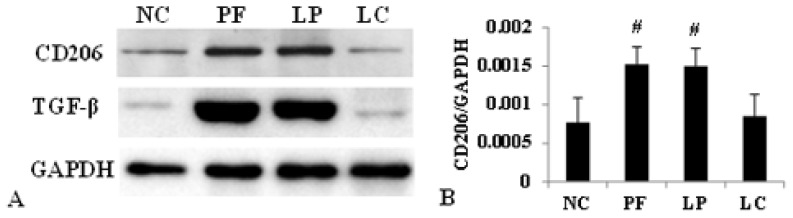
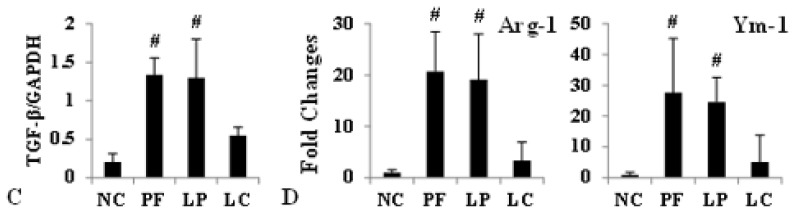
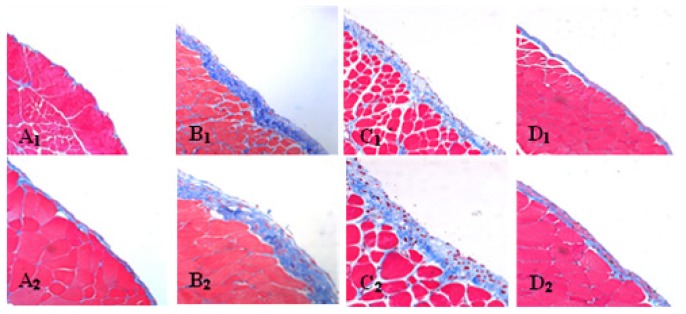
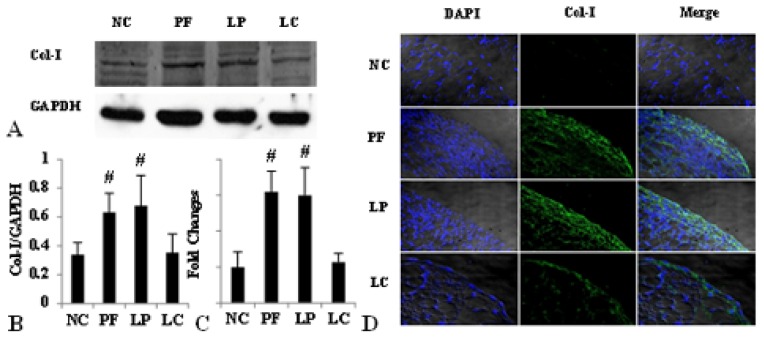
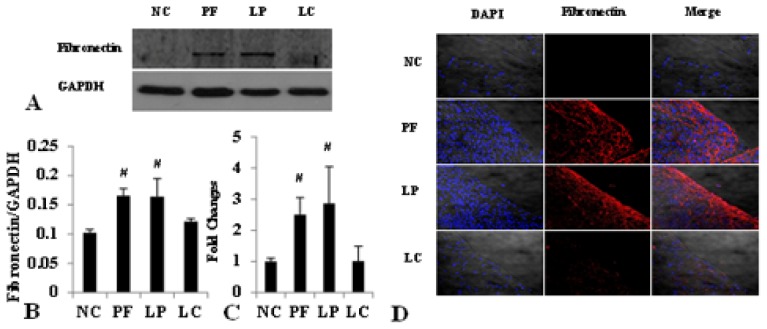
It has been confirmed that alternatively activated macrophages (M2) participate in tissue remodeling and fibrosis occurrence, but the effect of M2 on peritoneal fibrosis related to peritoneal dialysis (PD) hasn't been elucidated. This study was therefore conducted to assess the association between M2 and peritoneal fibrosis related to PD. In this study, peritoneal fibrosis was induced by intraperitoneal (i.p.) injection of Lactate-4.25% dialysate (100 mL/kg) to C57BL/6J mice for 28 days, and liposome-encapsulated clodronate (LC, the specific scavenger of macrophages) was used to treat the peritoneal fibrosis mice model by i.p. injection at day 18 and day 21. All animals were sacrificed at day 29. Parietal peritonea were stained with Masson's trichrome, and the expression of type I collagen (Col-I), fibronectin, mannose receptor (CD206), transforming growth factor beta (TGF-β), chemokine receptor 7 (CCR7), chitinase 3-like 3 (Ym-1) and arginase-1 (Arg-1) was determined by Western blotting, immunofluorescence and quantitative real-time PCR. Our results revealed that peritoneal thickness, Col-I, fibronectin, CD206, TGF-β, Ym-1 and Arg-1 were upregulated in the peritoneal fibrosis mice model, and all of these indexes were downregulated in those treated with LC. Additionally, there was no difference in the level of CCR7 between the model and treatment group. Our study indicated that peritoneal M2 played an important role in the process of peritoneal fibrosis related to PD and might be a potential target for intervention therapy of peritoneal fibrosis.
Figures
Similar articles
-
[Adipose-derived stem cells promote the polarization from M1 macrophages to M2 macrophages].Xi Bao Yu Fen Zi Mian Yi Xue Za Zhi. 2016 Mar;32(3):332-8. Xi Bao Yu Fen Zi Mian Yi Xue Za Zhi. 2016. PMID: 26927552 Chinese.
-
Characterization of infiltrating macrophages in high glucose-induced peritoneal fibrosis in rats.Mol Med Rep. 2012 Jul;6(1):93-9. doi: 10.3892/mmr.2012.890. Epub 2012 Apr 24. Mol Med Rep. 2012. PMID: 22552745
-
Markers of macrophage differentiation in experimental silicosis.J Leukoc Biol. 2004 Nov;76(5):926-32. doi: 10.1189/jlb.0104019. Epub 2004 Aug 3. J Leukoc Biol. 2004. PMID: 15292275
-
TSPO Modulates IL-4-Induced Microglia/Macrophage M2 Polarization via PPAR-γ Pathway.J Mol Neurosci. 2020 Apr;70(4):542-549. doi: 10.1007/s12031-019-01454-1. Epub 2019 Dec 26. J Mol Neurosci. 2020. PMID: 31879837
-
Roles of the TGF-β⁻VEGF-C Pathway in Fibrosis-Related Lymphangiogenesis.Int J Mol Sci. 2018 Aug 23;19(9):2487. doi: 10.3390/ijms19092487. Int J Mol Sci. 2018. PMID: 30142879 Free PMC article. Review.
Cited by
-
Ongoing Exposure to Peritoneal Dialysis Fluid Alters Resident Peritoneal Macrophage Phenotype and Activation Propensity.Front Immunol. 2021 Jul 27;12:715209. doi: 10.3389/fimmu.2021.715209. eCollection 2021. Front Immunol. 2021. PMID: 34386014 Free PMC article.
-
High glucose contributes to the polarization of peritoneal macrophages to the M2 phenotype in vivo and in vitro.Mol Med Rep. 2020 Jul;22(1):127-134. doi: 10.3892/mmr.2020.11130. Epub 2020 May 5. Mol Med Rep. 2020. PMID: 32377735 Free PMC article.
-
Encapsulating peritoneal sclerosis in children.Pediatr Nephrol. 2014 Nov;29(11):2093-103. doi: 10.1007/s00467-013-2672-8. Epub 2013 Nov 21. Pediatr Nephrol. 2014. PMID: 24258273 Review.
-
Mechanisms underlying the involvement of peritoneal macrophages in the pathogenesis and novel therapeutic strategies for dialysis-induced peritoneal fibrosis.Front Immunol. 2024 Dec 19;15:1507265. doi: 10.3389/fimmu.2024.1507265. eCollection 2024. Front Immunol. 2024. PMID: 39749340 Free PMC article. Review.
-
Therapeutic Potential of Oligo-Fucoidan in Mitigating Peritoneal Dialysis-Associated Fibrosis.Mar Drugs. 2024 Nov 25;22(12):529. doi: 10.3390/md22120529. Mar Drugs. 2024. PMID: 39728104 Free PMC article.
References
-
- Grassmann A., Gioberge S., Moeller S., Brown G. ESRD patients in 2004: Global overview of patient numbers, treatment modalities and associated trends. Nephrol. Dial. Transplant. 2005;20:2587–2593. - PubMed
-
- Aroeira L.S., Aguilera A., Sanchez-Tomero J.A., Bajo M.A., Del P.G., Jimenez-Heffernan J.A., Selgas R., Lopez-Cabrera M. Epithelial to mesenchymal transition and peritoneal membrane failure in peritoneal dialysis patients: pathologic significance and potential therapeutic interventions. J. Am. Soc. Nephrol. 2007;18:2004–2013. - PubMed
-
- Krediet R.T., Lindholm B., Rippe B. Pathophysiology of peritoneal membrane failure. Perit Dial. Int. 2000;20:S22–S42. - PubMed
-
- Di Paolo N., Sacchi G. Atlas of peritoneal histology. Perit Dial. Int. 2000;20:S5–S96. - PubMed
Publication types
MeSH terms
Substances
LinkOut - more resources
Full Text Sources
Other Literature Sources
Research Materials
Miscellaneous
