

Gold nanoparticle contrast agents in advanced X-ray imaging technologies
- PMID: 23685939
- PMCID: PMC6270207
- DOI: 10.3390/molecules18055858
Gold nanoparticle contrast agents in advanced X-ray imaging technologies
Abstract
Recently, there has been significant progress in the field of soft- and hard-X-ray imaging for a wide range of applications, both technically and scientifically, via developments in sources, optics and imaging methodologies. While one community is pursuing extensive applications of available X-ray tools, others are investigating improvements in techniques, including new optics, higher spatial resolutions and brighter compact sources. For increased image quality and more exquisite investigation on characteristic biological phenomena, contrast agents have been employed extensively in imaging technologies. Heavy metal nanoparticles are excellent absorbers of X-rays and can offer excellent improvements in medical diagnosis and X-ray imaging. In this context, the role of gold (Au) is important for advanced X-ray imaging applications. Au has a long-history in a wide range of medical applications and exhibits characteristic interactions with X-rays. Therefore, Au can offer a particular advantage as a tracer and a contrast enhancer in X-ray imaging technologies by sensing the variation in X-ray attenuation in a given sample volume. This review summarizes basic understanding on X-ray imaging from device set-up to technologies. Then this review covers recent studies in the development of X-ray imaging techniques utilizing gold nanoparticles (AuNPs) and their relevant applications, including two- and three-dimensional biological imaging, dynamical processes in a living system, single cell-based imaging and quantitative analysis of circulatory systems and so on. In addition to conventional medical applications, various novel research areas have been developed and are expected to be further developed through AuNP-based X-ray imaging technologies.
Figures

Similar articles
-
Evaluation of X-ray tomography contrast agents: A review of production, protocols, and biological applications.Microsc Res Tech. 2019 Jun;82(6):812-848. doi: 10.1002/jemt.23225. Epub 2019 Feb 20. Microsc Res Tech. 2019. PMID: 30786098 Review.
-
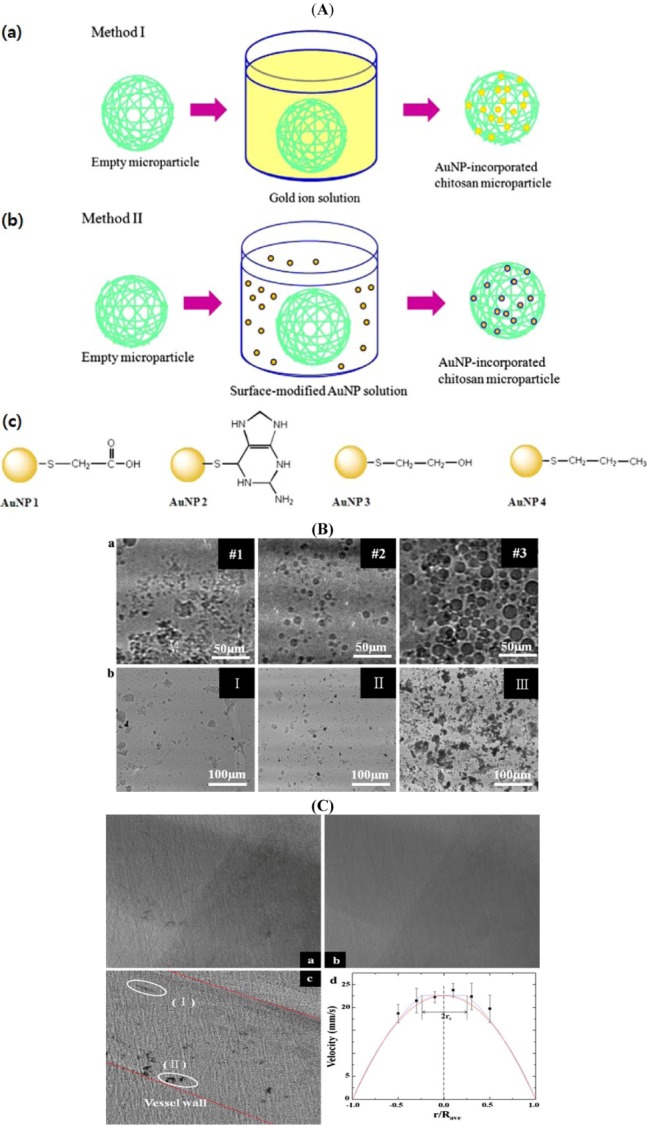
Chitosan microparticles incorporating gold as an enhanced contrast flow tracer in dynamic X-ray imaging.Acta Biomater. 2011 May;7(5):2139-47. doi: 10.1016/j.actbio.2011.01.015. Epub 2011 Jan 15. Acta Biomater. 2011. PMID: 21241831
-
Inorganic Nanoparticles for X-Ray Computed Tomography Imaging.Crit Rev Ther Drug Carrier Syst. 2018;35(5):391-431. doi: 10.1615/CritRevTherDrugCarrierSyst.2018020974. Crit Rev Ther Drug Carrier Syst. 2018. PMID: 30317944 Review.
-
The benefits of folic acid-modified gold nanoparticles in CT-based molecular imaging: radiation dose reduction and image contrast enhancement.Artif Cells Nanomed Biotechnol. 2018 Dec;46(8):1993-2001. doi: 10.1080/21691401.2017.1408019. Epub 2017 Dec 12. Artif Cells Nanomed Biotechnol. 2018. PMID: 29233015
-
Tunable, biodegradable gold nanoparticles as contrast agents for computed tomography and photoacoustic imaging.Biomaterials. 2016 Sep;102:87-97. doi: 10.1016/j.biomaterials.2016.06.015. Epub 2016 Jun 7. Biomaterials. 2016. PMID: 27322961 Free PMC article.
Cited by
-
Self-therapeutic metal-based nanoparticles for treating inflammatory diseases.Acta Pharm Sin B. 2023 May;13(5):1847-1865. doi: 10.1016/j.apsb.2022.07.009. Epub 2022 Jul 19. Acta Pharm Sin B. 2023. PMID: 37250153 Free PMC article. Review.
-
Applications of nanoparticles in biomedical imaging.Nanoscale. 2019 Jan 17;11(3):799-819. doi: 10.1039/c8nr07769j. Nanoscale. 2019. PMID: 30603750 Free PMC article. Review.
-
In vivo evaluation of safety, biodistribution and pharmacokinetics of laser-synthesized gold nanoparticles.Sci Rep. 2019 Sep 9;9(1):12890. doi: 10.1038/s41598-019-48748-3. Sci Rep. 2019. PMID: 31501470 Free PMC article.
-
Personalised Profiling of Innate Immune Memory Induced by Nano-Imaging Particles in Human Monocytes.Front Immunol. 2021 Aug 6;12:692165. doi: 10.3389/fimmu.2021.692165. eCollection 2021. Front Immunol. 2021. PMID: 34421901 Free PMC article.
-
Stabilizing gold nanoparticles for use in X-ray computed tomography imaging of soil systems.R Soc Open Sci. 2019 Oct 16;6(10):190769. doi: 10.1098/rsos.190769. eCollection 2019 Oct. R Soc Open Sci. 2019. PMID: 31824700 Free PMC article.
References
-
- Jadzinsky P.D., Calero G., Ackerson C.J., Bushnell D.A., Kornberg R.D. Structure of a thiol monolayer-protected gold nanoparticle at 1.1 A resolution. Science. 2007;318:430–433. - PubMed
-
- Lee J.S., Ulmann P.A., Han M.S., Mirkin C.A. A DNA-gold nanoparticle-based colorimetric competition assay for the detection of cysteine. Nano Lett. 2008;8:529–533. - PubMed
-
- Sokolov K., Follen M., Aaron J., Pavlova I., Malpica A., Lotan R. Richards-Kortum, R. Real-time vital optical imaging of precancer using anti-epidermal growth factor receptor antibodies conjugated to gold nanoparticles. Cancer Res. 2003;63:1999–2004. - PubMed
Publication types
MeSH terms
Substances
LinkOut - more resources
Full Text Sources
Other Literature Sources
