. 2013 Nov 21;32(47):5421-8.
doi: 10.1038/onc.2013.162. Epub 2013 May 20.

DNA methylation determines nucleosome occupancy in the 5'-CpG islands of tumor suppressor genes

Affiliations
Free PMC article

DNA methylation determines nucleosome occupancy in the 5'-CpG islands of tumor suppressor genes

A Portela et al. Oncogene. .
Free PMC article

Abstract

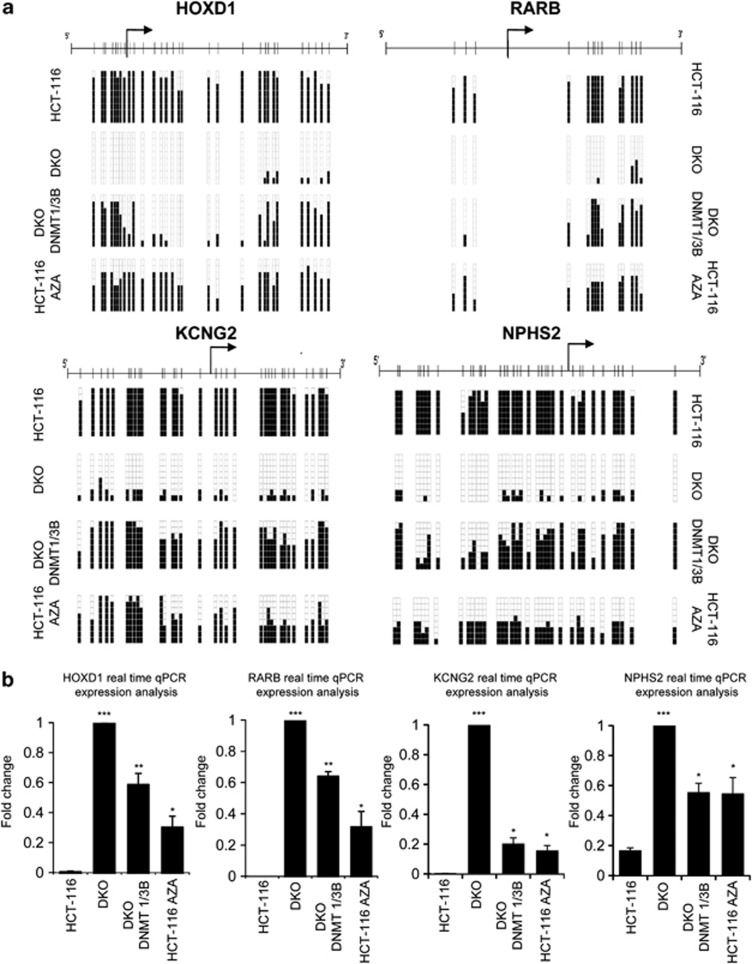
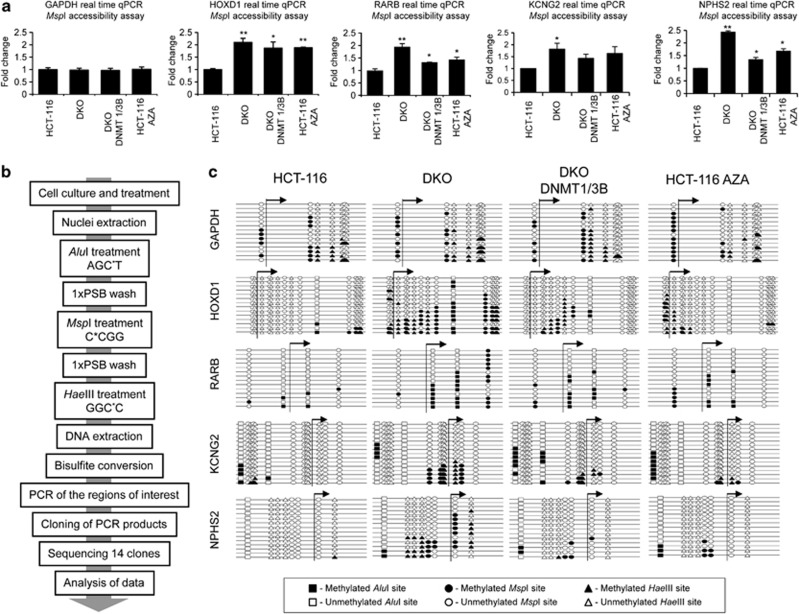
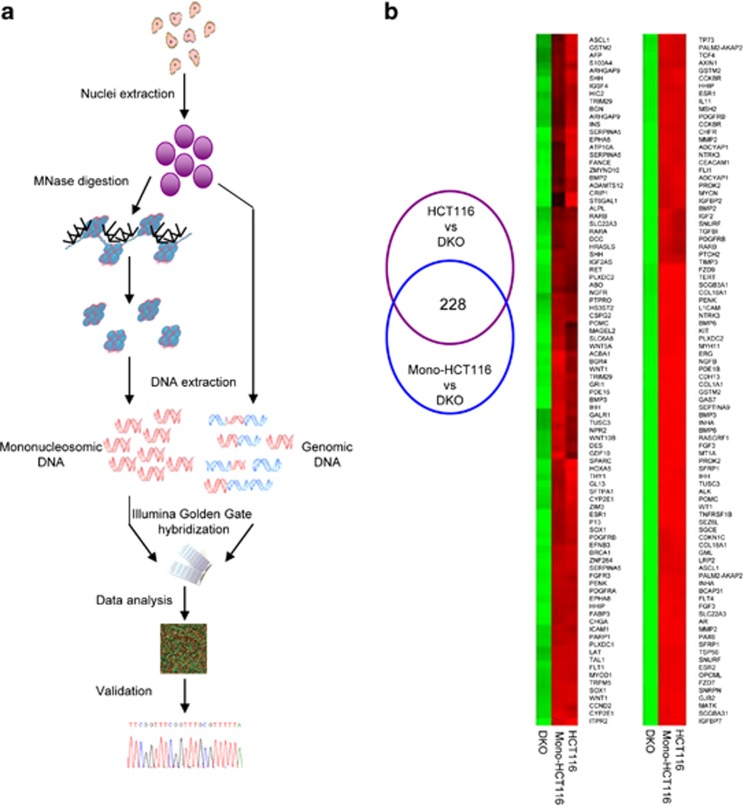
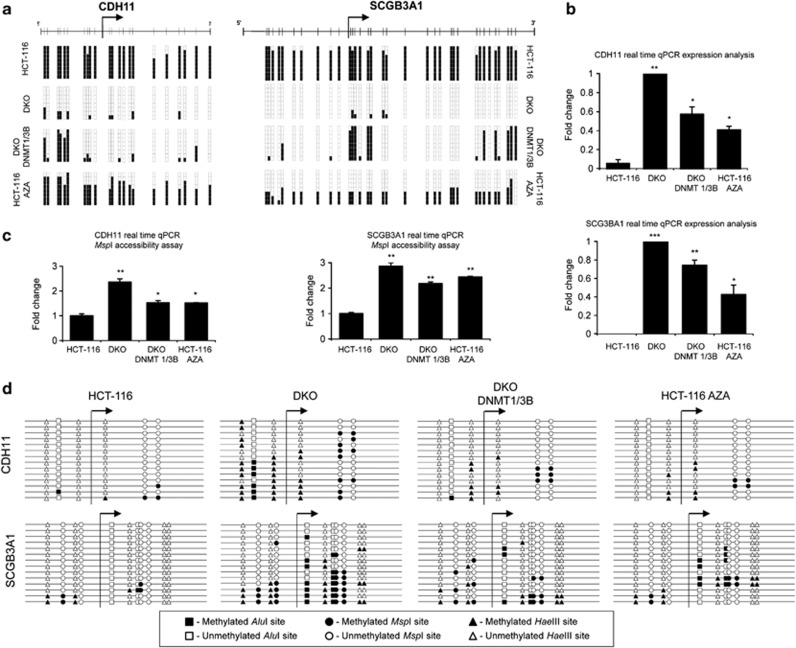
Promoter CpG island hypermethylation of tumor suppressor genes is an epigenetic hallmark of human cancer commonly associated with nucleosome occupancy and the transcriptional silencing of the neighboring gene. Nucleosomes can determine the underlying DNA methylation status. Herein, we show that the opposite is also true: DNA methylation can determine nucleosome positioning. Using a cancer model and digital nucleosome positioning techniques, we demonstrate that the induction of DNA hypomethylation events by genetic (DNMT1/DNMT3B deficient cells) or drug (a DNA demethylating agent) approaches is associated with the eviction of nucleosomes from previously hypermethylated CpG islands of tumor suppressor genes. Most importantly, the establishment of a stable cell line that restores DNMT1/DNMT3B deficiency shows that nucleosomes reoccupy their positions in de novo methylated CpG islands. Finally, we extend these results to the genomic level, combining a DNA methylation microarray and the nucleosome positioning technique. Using this global approach, we observe the dependency of nucleosome occupancy upon the DNA methylation status. Thus, our results suggest that there is a close association between hypermethylated CpG islands and the presence of nucleosomes, such that each of these epigenetic mechanisms can determine the recruitment of the other.


Figures

Figure 1
Figure 1
5′-CpG island DNA methylation is associated with transcriptional silencing. (a) DNA methylation status of the region containing the TSS is shown (regions upstream and downstream of the TSS are shown in Supplementary Figure S2). In each case, eight bisulfite-modified clones were sequenced. Black and white squares correspond to methylated and unmethylated CpG, respectively. (b) Expression of HOXD1, RARB, KCNG2 and NPHS2 is shown for all the cell lines and cases studied. Statistical significance in real-time experiments has been assessed with an analysis of variance (ANOVA) test (*P<0.05, **P<0.01, ***P<0.001).
Figure 2
Figure 2
DNA methylation determines nucleosome positioning. (a) MspI accessibility assay. Results are depicted as the n-fold difference between undigested DNA and 400 U/ml digested DNA. Only the results from the region containing the TSS are presented (regions upstream and downstream of the TSS are shown in Supplementary Figure S5). The results of the MspI accessibility assay are correlated with nucleosome occupancy. The results represent the ratio undigested/digested for each sample normalized to undigested/digested for HCT116. (b) Adaptation of the methyltransferase-based single-promoter analysis assay (M-SPA) protocol for use in studying methylated sequences. (c) Adapted M-SPA protocol for studying the same regions studied in (a) at higher resolution. Circles, triangles and squares, respectively, represent methylation sites of MspI (C*CGG), HaeIII (GGC*C) and AluI (AGC*T). Black and white figures represent methylated and unmethylated sites, respectively. Accessible regions, in which nucleosomes are not present, become methylated, whereas inaccessible regions do not. Only the results from the region containing the TSS are presented (regions upstream and downstream of the TSS are shown in Supplementary Figure S9). Statistical significance in real-time experiments has been assessed with an ANOVA test (*P<0.05, **P<0.01, ***P<0.001).
Figure 3
Figure 3
Genome-wide approach for DNA methylation and nucleosome positioning. (a) Detailed flowchart of the protocol followed to obtain genome-wide data. (b) Analysis of genome-wide data. The Venn diagram shows the analysis done to select the DNA-methylated regions that are protected by nucleosomes. Images below are of two significant regions of the DNA methylation microarray. Green rectangles, unmethylated DNA sequences; Red rectangles, methylated DNA sequences.
Figure 4
Figure 4
DNA methylation, expression and nucleosome positioning of the candidate genes obtained from the array. (a) DNA methylation status of the region containing the TSS is shown in the genes selected to validate the arrays: CDH11 and SCGB3A1 (regions upstream and downstream of the TSS are shown in Supplementary Figure S12). In each case, eight bisulfite-modified clones were sequenced. Black and white squares correspond to methylated and unmethylated CpG, respectively. (b) CDH11 and SCGB3A1 expression determined by quantitative PCR. (c) MspI accessibility assay. The results are depicted as the n-fold difference between undigested DNA and 400 U/ml digested DNA. Only the results from the region containing the TSS are presented (regions upstream and downstream of the TSS are shown in Supplementary Figure S13). (d) Adapted M-SPA protocol for studying the same regions as in (a) at higher resolution. Circles, triangles and squares, respectively, represent methylation sites of MspI (C*CGG), HaeIII (GGC*C) and AluI (AGC*T). Black and white figures represent methylated and unmethylated sites, respectively. Accessible regions, in which nucleosomes are not positioned, become methylated, while inaccessible regions remain unmethylated. Only the results from the region containing the TSS are presented (regions upstream and downstream of the TSS are shown in Supplementary Figure S13). Statistical significance in real-time experiments has been assessed with an ANOVA test (*P<0.05, **P<0.01, ***P<0.001).

Similar articles

Cited by

References

    1. Esteller M. Cancer epigenomics: DNA methylomes and histone-modification maps. Nat Rev Genet. 2007;8:286–298. - PubMed
    1. Shen L, Kondo Y, Guo Y, Zhang J, Zhang L, Ahmed S, et al. Genome-wide profiling of DNA methylation reveals a class of normally methylated CpG island promoters. PLoS Genet. 2007;3:2023–2036. - PMC - PubMed
    1. Portela A, Esteller M. Epigenetic modifications and human disease. Nat Biotechnol. 2010;28:1057–1068. - PubMed
    1. Li B, Carey M, Workman JL. The role of chromatin during transcription. Cell. 2007;128:707–719. - PubMed
    1. Hodges C, Bintu L, Lubkowska L, Kashlev M, Bustamante C. Nucleosomal fluctuations govern the transcription dynamics of RNA polymerase II. Science. 2009;325:626–628. - PMC - PubMed

Publication types

MeSH terms

Substances