. 2013 May 17;2(3):e000134.
doi: 10.1161/JAHA.113.000134.

Deficiency of TDAG51 protects against atherosclerosis by modulating apoptosis, cholesterol efflux, and peroxiredoxin-1 expression

Affiliations

Deficiency of TDAG51 protects against atherosclerosis by modulating apoptosis, cholesterol efflux, and peroxiredoxin-1 expression

Gazi S Hossain et al. J Am Heart Assoc. .

Abstract

Background: Apoptosis caused by endoplasmic reticulum (ER) stress contributes to atherothrombosis, the underlying cause of cardiovascular disease (CVD). T-cell death-associated gene 51 (TDAG51), a member of the pleckstrin homology-like domain gene family, is induced by ER stress, causes apoptosis when overexpressed, and is present in lesion-resident macrophages and endothelial cells.

Methods and results: To study the role of TDAG51 in atherosclerosis, male mice deficient in TDAG51 and apolipoprotein E (TDAG51(-/-)/ApoE(-/-)) were generated and showed reduced atherosclerotic lesion growth (56 ± 5% reduction at 40 weeks, relative to ApoE(-/-) controls, P<0.005) and necrosis (41 ± 4% versus 63 ± 8% lesion area in TDAG51(-/-)/ApoE(-/-) and ApoE(-/-), respectively; P<0.05) without changes in plasma levels of lipids, glucose, and inflammatory cytokines. TDAG51 deficiency caused several phenotypic changes in macrophages and endothelial cells that increase cytoprotection against oxidative and ER stress, enhance PPARγ-dependent reverse cholesterol transport, and upregulate peroxiredoxin-1 (Prdx-1), an antioxidant enzyme with antiatherogenic properties (1.8 ± 0.1-fold increase in Prdx-1 protein expression, relative to control macrophages; P<0.005). Two independent case-control studies found that a genetic variant in the human TDAG51 gene region (rs2367446) is associated with CVD (OR, 1.15; 95% CI, 1.07 to 1.24; P=0.0003).

Conclusions: These findings provide evidence that TDAG51 affects specific cellular pathways known to reduce atherogenesis, suggesting that modulation of TDAG51 expression or its activity may have therapeutic benefit for the treatment of CVD.

Keywords: apoptosis; arteriosclerosis; atherosclerosis; cardiovascular diseases.


Figures

Figure 1.
Figure 1.
Identification of TDAG51−/−/ApoE−/− mice. Mouse genomic DNA was amplified by PCR using specific primer sets, and the PCR products were separated on agarose gels to identify mice containing the wild‐type TDAG51 allele (wt‐TDAG51) (A) or the disrupted TDAG51 allele (ko‐TDAG51) (B). PCR amplification and gel electrophoresis was also used to identify mice that were deleted for the ApoE allele (C). Neg, negative controls for PCR reactions (A through C). Liver tissue obtained from PCR identified TDAG51−/−/ApoE−/− dKO or control TDAG51+/+/ApoE−/− mice was homogenized, and total protein lysates were examined by immunoblotting using an anti‐TDAG51 antibody (D). β‐actin was used as a loading control. TDAG51 indicates T‐cell death‐associated gene 51; PCR, polymerase chain reaction; ApoE, apolipoprotein E; ko, knockout; dKO, double knockout.
Figure 2.
Figure 2.
Effect of TDAG51 deficiency on plasma lipoproteins and glucose in ApoE−/− mice. TDAG51−/−/ApoE−/− mice (dKO) and ApoE−/− control mice were fed standard chow diets for 25 or 40 weeks (n=8 to 9 per group). Following euthanization, plasma was collected, and (A) total cholesterol, (B) triglycerides, (C) lipoprotein profiles, and (D) glucose were determined. Plasma lipoprotein profiles were obtained from 25‐week‐old mice by fast protein liquid chromatography. TDAG51 indicates T‐cell death‐associated gene 51; ApoE, apolipoprotein E; dKO, double knockout; IDL, intermediate‐density lipoprotein; LDL, low‐density lipoprotien; HDL, high‐density lipoprotein.
Figure 3.
Figure 3.
Identification of insulin and glucagon in β cells from the islets of Langerhans. Representative sections from 5 mice per group of pancreatic tissue from 25‐week‐old TDAG51+/+/ApoE−/− (ApoE−/−) or TDAG51−/−/ApoE−/− (dKO) mice immunostained for insulin (red) or glucagon (green). Scale bars, 50 μm. TDAG51 indicates T‐cell death‐associated gene 51; ApoE, apolipoprotein E; dKO, double knockout.
Figure 4.
Figure 4.
Expression of TDAG51 in atherosclerotic lesions. Six‐week‐old TDAG51+/+/ApoE−/− and TDAG51−/−/ApoE−/− mice were fed control chow diet for 25 weeks. Mice were euthanized, and hearts containing aortic roots were removed, embedded in paraffin, sectioned, and immunostained for TDAG51. Indirect immunofluorescence detection of TDAG51 in lesions (arrows) from aortic roots of TDAG51+/+/ApoE−/− mice (A and B). B, Magnified region from A. Representative images from 5 mice are shown. To assess nonspecific immunofluorescence, aortic root sections from TDAG51−/−/ApoE−/− mice were immunostained using an anti‐TDAG51 antibody (C). Scale bars: 100 μm in A and C; 50 μm in B. TDAG51 indicates T‐cell death‐associated gene 51; ApoE, apolipoprotein E.
Figure 5.
Figure 5.
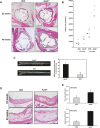
Effect of TDAG51 deficiency on atherosclerotic lesions in ApoE−/− mice. TDAG51−/−/ApoE−/− mice (dKO) and ApoE−/− control mice were fed standard chow diets for 25 or 40 weeks (n=8 to 9 per group). A and B, Aortic root sections were stained with hematoxylin/eosin, and mean atherosclerotic lesion size was determined. Significant reduction (*P<0.05) in lesion size was observed at both 25 and 40 weeks in dKO compared with ApoE−/− control groups. Black line demarcates lesion area. Scale bar=500 μm. C, Representative en face Oil Red O (ORO)‐stained aortas and quantitative assessment showed significant reduction (*P=0.0016) in lipid deposition in aortas from 40‐week‐old dKO mice compared with the control group. For quantitative data, results from 3 independent experiments are shown. D, Representative images are shown of necrotic core sizes in aortic root lesions of 25‐ and 40‐week‐old dKO and ApoE−/− mice (n=5). Red line demarcates necrotic core area. Scale bar=100 μm. E, Necrotic core sizes of 25‐ and 40‐week‐old dKO mice were smaller in aortic root lesions compared with their respective ApoE−/− control groups (n=5). Data are shown as mean necrotic core area±SE (*P<0.005). TDAG51 indicates T‐cell death‐associated gene 51; ApoE, apolipoprotein E; dKO, double knockout.
Figure 6.
Figure 6.
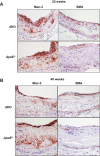
Morphological assessment of atherosclerotic lesions from TDAG51−/−/ApoE−/− (dKO) and ApoE−/− control mice. Atherosclerotic lesions from aortic roots of mice fed control chow diet for 25 or 40 weeks (n=8 to 9 per group) were studied. A, Hearts containing aortic roots of 25‐week‐old mice were removed, embedded in paraffin, sectioned, and immunostained for macrophages (Mac‐3) and smooth muscle cells (SMA). A representative image is shown of 5 mice per group. Microscope magnification ×20. B, Hearts containing aortic roots of 40‐week‐old mice were removed, embedded in paraffin, sectioned, and immunostained for Mac‐3 and SMA. A representative image is shown of 5 mice per group. Microscope magnification ×20. TDAG51 indicates T‐cell death‐associated gene 51; ApoE, apolipoprotein E; dKO, double knockout.
Figure 7.
Figure 7.
Collagen content in atherosclerotic lesions. Six‐week‐old TDAG51+/+/ApoE−/− (ApoE−/−) and TDAG51−/−/ApoE−/− (dKO) mice were fed control chow diet for 25 weeks. Hearts containing aortic roots were removed, embedded in paraffin, sectioned, and stained with Masson's trichrome. Different sections from the same lesion were shown to demonstrate intralesion variability in collagen positivity (blue color). Representative images from 5 mice per group are shown. Scale bar=50 μm. TDAG51 indicates T‐cell death‐associated gene 51; ApoE, apolipoprotein E; dKO, double knockout.
Figure 8.
Figure 8.
Calcification in atherosclerotic lesions. TDAG51+/+/ApoE−/− (ApoE−/−) and TDAG51−/−/ApoE−/− (dKO) mice were fed chow diet for 40 weeks. Hearts containing aortic roots were removed, sectioned, and stained with von Kossa. Representative images from 3 mice per group are shown. Scale bar=100 μm. TDAG51 indicates T‐cell death‐associated gene 51; ApoE, apolipoprotein E; dKO, double knockout.
Figure 9.
Figure 9.
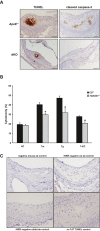
TDAG51 deficiency reduces cell death in atherosclerotic lesions and peritoneal macrophages. TDAG51−/−/ApoE−/− (dKO) or ApoE−/− mice were placed on control chow diet for 25 weeks. A, Representative images of atherosclerotic lesions from 5 mice per group were stained for TUNEL and cleaved caspase‐3. Microscope magnification ×20. B, Peritoneal macrophages isolated from wild‐type C57BL/6 (C57) mice or TDAG51−/− mice were treated with 2.5 μg/mL tunicamycin (Tm), 100 nmol/L thapsigargin (Tg), or 10 μmol/L 7‐ketocholesterol (7‐KC) for 24 hours. Cytotoxicity was determined by measuring LDH release. Mean±SE from 5 independent experiments are shown. *P<0.05 relative to C57 controls. C, Negative controls for IHC sections. Primary antibodies were omitted, and only secondary antibodies were used (anti‐mouse, anti‐rat, or anti‐rabbit, with heat‐induced epitope retrieval [HIER] where specified). Negative control for the TUNEL staining had no terminal deoxynucleotidyl transferase (TdT) added to the staining mixture. TDAG51 indicates T‐cell death‐associated gene 51; ApoE, apolipoprotein E; dKO, double knockout; LDH, lactate dehydrogenase; IHC, immunohistochemistry; PPARγ, peroxisome proliferator‐activated receptor γ; ab, antibody; NT, nontreated.
Figure 10.
Figure 10.
TDAG51 deficiency increases PPARγ expression and nuclear localization in lesion‐resident macrophages. A, TDAG51−/−/ApoE−/− (dKO) or ApoE−/− mice were placed on control chow diet for 15 or 25 weeks. Atherosclerotic lesions from the aortic roots were sectioned and immunostained for PPARγ. Arrows indicate PPARγ‐positive staining macrophages. Representative images from 5 mice per group are shown. Scale bar=50 μm. B, Identification of PPARγ in adipose tissue from TDAG51+/+/ApoE−/− (ApoE−/−) and TDAG51−/−/ApoE−/− (dKO) mice fed chow diet for 40 weeks. Fat pads were removed, embedded in paraffin, sectioned, and immunostained for PPARγ. Arrows indicate positive nuclear immunostaining for PPARγ. Consistent with lesion‐resident TDAG51−/− macrophages, intensity of nuclear PPARγ staining was increased in TDAG51−/− adipocytes. Representative images from 5 mice per group are shown. Scale bar=100 μm. C, Optical sections 0.8 μm in thickness were obtained through TDAG51−/− and C57BL/6 (C57) peritoneal macrophages at the plane of the nuclei (arrows). In C57 macrophages, little PPARγ (green) was visualized within the nucleus, whereas in TDAG51−/− macrophages, PPARγ (green) was found to colocalize (merged green and red producing yellow) with nucleic acids (red) as shown by ethidium bromide (EtBr) staining in the nuclei (arrows). Representative images from 3 independent experiments are shown. Scale bar=10 μm. TDAG51 indicates T‐cell death‐associated gene 51; ApoE, apolipoprotein E; dKO, double knockout; PPARγ, peroxisome proliferator‐activated receptor γ.
Figure 11.
Figure 11.
Detection of PPARγ and its target genes in peritoneal macrophages. Total RNA was isolated from male TDAG51−/− or C57BL/6 (C57) peritoneal macrophages and mRNA expression assessed by qRT‐PCR. Data were normalized to 18s, and fold‐change in expression relative to C57 was determined. Results from 5 independent experiments are shown as mean±SE. *P<0.05, relative to C57 controls. PPARγ indicates peroxisome proliferator‐activated receptor γ; TDAG51, T‐cell death‐associated gene 51; qRT‐PCR, quantitative real‐time polymerase chain reaction.
Figure 12.
Figure 12.
TDAG51 deficiency increases rosiglitazone‐dependent inhibition of inflammatory marker expression in peritoneal macrophages. A, Peritoneal macrophages isolated from TDAG51−/− or C57BL/6 (C57) mice were incubated in the presence or absence of 20 μmol/L rosiglitazone (Rosi). mRNA expression of MCP‐1 and TNF‐α were assessed by qRT‐PCR. Data from 6 independent experiments are shown as mean±SE. *P<0.05 vs nontreated controls; ^P<0.05 vs C57+rosiglitazone. B, Peritoneal macrophages isolated from TDAG51−/− or C57BL/6 (C57) mice were incubated in the presence or absence of 50 ng/mL lipopolysaccharide (LPS). mRNA expression of MCP‐1 and TNF‐α was assessed by qRT‐PCR. Data from 6 independent experiments are shown as mean±SE. *P<0.05 vs controls; ^P<0.05 vs C57+LPS. C, THP‐1 monocytes were incubated in the presence or absence of 100 nmol/L PMA for 48 hours. Following incubation, THP‐1 monocytes and PMA‐derived THP‐1 macrophages were immunoblotted for TDAG51. Untreated human aortic endothelial cells (HAECs) and human aortic smooth muscle cells (HASMCs) were also immunoblotted for TDAG51. βactin was used as a loading control. Representative immunoblots from 3 independent experiments are shown. D, Atherosclerotic lesions from human carotid arteries were stained by double immunofluorescence to identify the cell types positive for TDAG51. Some of the smooth muscle cells (positive for smooth muscle actin [SMA]), macrophages (positive for CD68), and endothelial cells (positive for vWF) were also positive for TDAG51 (arrows). Scale bar=100 μm. TDAG51 indicates T‐cell death‐associated gene 51; qRT‐PCR, quantitative real‐time polymerase chain reaction; TNF‐α, tumor necrosis factor α; vWF, von Willebrand factor; MCP‐1, monocyte chemoattractant protein‐1; THP‐1, human monocytic cell line; PMA, phorbol 12‐myristate 13‐acetate.
Figure 13.
Figure 13.
Lipid accumulation and cholesterol efflux in TDAG51−/− peritoneal macrophages. A, Representative images from 3 independent experiments of Oil Red O (ORO) staining of C57BL/6 (C57) or TDAG51−/− macrophages treated with acetylated LDL for 24 or 48 hours. Scale bar=20 μm. The amount of ORO staining was quantified B and is shown as mean±SE from 3 independent experiments. *P<0.05 compared with C57 macrophages. C and D, C57BL/6 (C57) or TDAG51−/− peritoneal macrophages were incubated in the presence or absence of 50 μg/mL acetylated LDL for 24 or 48 hours. Lipids were extracted and cellular total C or free D cholesterol assessed biochemically. Cholesterol was normalized to cellular protein, and fold‐change relative to C57 controls was calculated. *P<0.05 vs 0 hours controls; ^P<0.05 vs C57 at the same point. Data are shown as mean fold‐change±SE (n=6). E, C57BL/6 (C57) or TDAG51−/− peritoneal macrophages were incubated in the presence or absence of 50 μg/mL acetylated LDL or 10 μmol/L GW9662 for 48 hours. Lipids were extracted and cellular total cholesterol assessed. *P<0.05 vs nontreated (NT) controls; ^P<0.05 vs C57 controls; ΨP<0.05 vs acLDL‐treated groups. Data are shown as mean fold‐change±SE (n=10). F, HDL‐dependent cholesterol efflux from TDAG51−/− or C57 peritoneal macrophages. Mean±SE from 5 independent experiments is shown. *P<0.05 compared with C57 controls. TDAG51 indicates T‐cell death‐associated gene 51; LDL, low‐density lipoprotein; HDL, high‐density lipoprotein; acLDL, acetyl‐LDL; acLDL+GW, acetyl‐LDL+GW9662.
Figure 14.
Figure 14.
TDAG51 deficiency increases Prdx‐1 expression in atherosclerotic lesions and reduces intracellular superoxide levels in TDAG51−/− peritoneal macrophages. TDAG51−/−/ApoE−/− (dKO) or ApoE−/− mice were placed on control chow diet. Atherosclerotic lesions from aortic roots of (A) 25‐week‐old mice or (B) 40‐week‐old mice were sectioned and consecutive sections immunostained for Prdx‐1 and von Willebrand factor (vWF). Arrows indicate endothelium; arrowheads indicate macrophages/foam cells. Scale bar=100 μm. Representative images are shown from 5 mice per group. C, Percentage of Prdx‐1 positivity in endothelium (measured as the length of Prdx1‐positive endothelium divided by the total length of endothelium as immunostained with vWF) of 25‐ and 40‐week‐old dKO and ApoE−/− mice. The averages of 5 sections per mouse were assessed. *P<0.05 compared with ApoE−/− (n=8 to 9 for each genotype). D, Peritoneal macrophages isolated from TDAG51−/− mice exhibited elevated levels of Prdx‐1 protein, as determined by immunoblotting. Data are shown as mean±SE (n=9). *P<0.05 relative to C57BL/6 (C57) macrophages. E, TDAG51−/− peritoneal macrophages displayed lower levels of superoxide at both baseline and when subjected to 10 μmol/L 7‐ketocholesterol (7‐KC). Mean±SE from 6 independent experiments is shown. *P<0.05 relative to C57 macrophages. F, Peritoneal macrophages from C57BL/6 or TDAG51−/− mice were incubated in the presence or absence of 20 μmol/L rosiglitazone (Rosi) for 18 hours and then immunoblotted for Prdx‐1. Data are shown as mean±SE (n=9). *P<0.05 vs C57 controls; ^P<0.05 vs respective nontreated (NT) macrophages. TDAG51 indicates T‐cell death‐associated gene 51; Prdx‐1, peroxiredoxin‐1; ApoE, apolipoprotein E; dKO, double knockout; RFU, relative fluorescence unit.
Figure 15.
Figure 15.
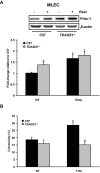
Prdx‐1 expression in TDAG51−/− mouse lung endothelial cells. A, Mouse lung endothelial cells (MLECs) from C57BL/6 (C57) or TDAG51−/− mice were treated in the presence or absence of 20 μmol/L rosiglitazone (Rosi) for 18 hours. After incubation, Prdx‐1 protein levels were assessed by immunoblotting. Data are shown as mean±SE (n=10). *P<0.05 vs respective nontreated (NT) controls; ^P<0.05 vs nontreated C57. B, C57BL/6 and TDAG51−/− mouse lung endothelial cells were incubated in the presence or absence of 5 μmol/L 7‐ketocholesterol (7‐KC) for 24 hours. Cytotoxicity was determined by measuring LDH release. Data are shown as mean±SE (n=7). *P<0.05 vs nontreated C57; ^P<0.05 vs 7‐KC‐treated C57. TDAG51 indicates T‐cell death‐associated gene 51; Prdx‐1, peroxiredoxin‐1; ApoE, apolipoprotein E; LDH, lactate dehydrogenase.
Figure 16.
Figure 16.
TDAG51 deficiency protects vascular smooth muscle cells (VSMCs) against endoplasmic reticulum (ER) and oxidative stress. VSMCs isolated from C57BL/6 (C57), TDAG51+/−, and TDAG51−/− mice were incubated in the presence or absence of 1 μg/mL tunicamycin (Tm), 200 nmol/L thapsigargin (Tg), or 1 μmol/L staurosporine for 48 hours. Cytotoxicity was determined by measuring LDH release. Results from 4 independent experiments are shown as mean±SE. *P<0.05 relative to respective genotype controls; ^P<0.05 compared with respective C57 group; #P<0.05 compared with respective TDAG51+/− group. TDAG51 indicates T‐cell death‐associated gene 51; LDH, lactate dehydrogenase.

Similar articles

Cited by

References

    1. Lloyd‐Jones DM. Cardiovascular risk prediction: basic concepts, current status, and future directions. Circulation. 2010; 121:1768-1777 - PubMed
    1. Lusis AJ. Atherosclerosis. Nature. 2000; 407:233-241 - PMC - PubMed
    1. Moore KJ, Tabas I. Macrophages in the pathogenesis of atherosclerosis. Cell. 2011; 145:341-355 - PMC - PubMed
    1. Isner JM, Kearney M, Bortman S, Passeri J. Apoptosis in human atherosclerosis and restenosis. Circulation. 1995; 91:2703-2711 - PubMed
    1. Thorp E, Li G, Seimon TA, Kuriakose G, Ron D, Tabas I. Reduced apoptosis and plaque necrosis in advanced atherosclerotic lesions of ApoE−/− and Ldlr−/− mice lacking chop. Cell Metab. 2009; 9:474-481 - PMC - PubMed

Publication types

LinkOut - more resources