. 2013 May 17;2(3):e004796.
doi: 10.1161/JAHA.113.004796.

Glucose regulation of load-induced mTOR signaling and ER stress in mammalian heart

Affiliations

Glucose regulation of load-induced mTOR signaling and ER stress in mammalian heart

Shiraj Sen et al. J Am Heart Assoc. .

Abstract

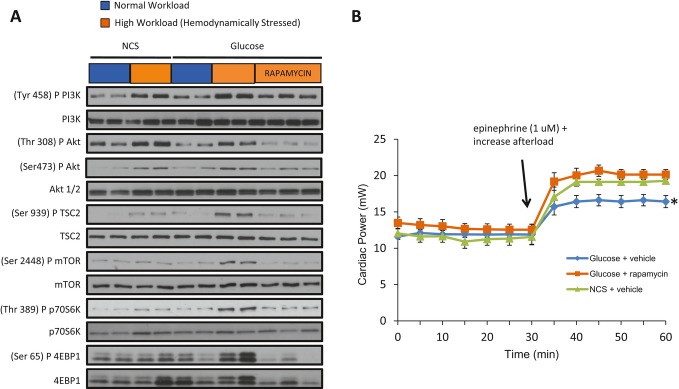
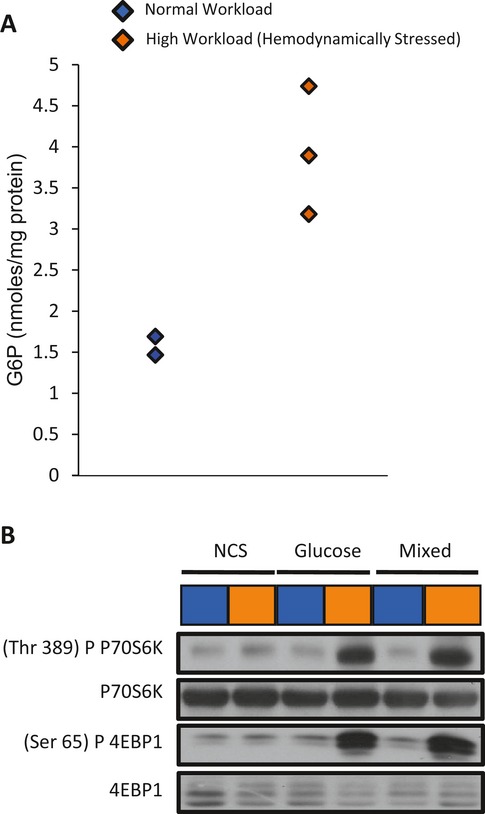
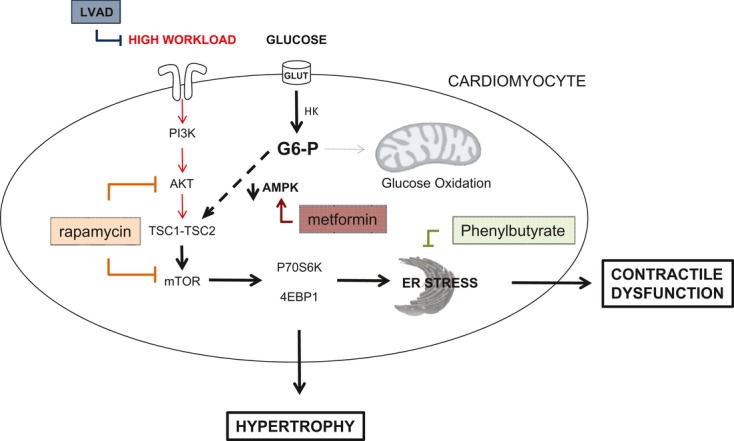
Background: Changes in energy substrate metabolism are first responders to hemodynamic stress in the heart. We have previously shown that hexose-6-phosphate levels regulate mammalian target of rapamycin (mTOR) activation in response to insulin. We now tested the hypothesis that inotropic stimulation and increased afterload also regulate mTOR activation via glucose 6-phosphate (G6P) accumulation.

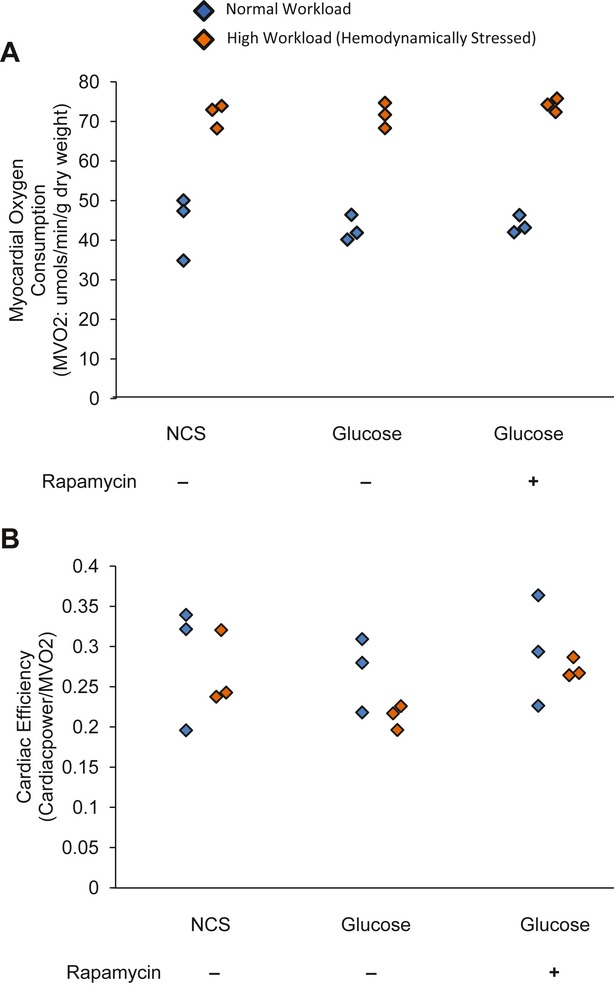
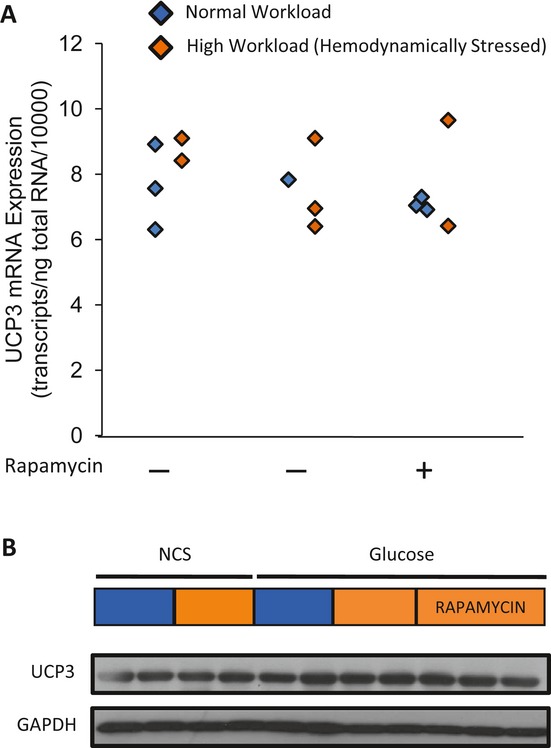
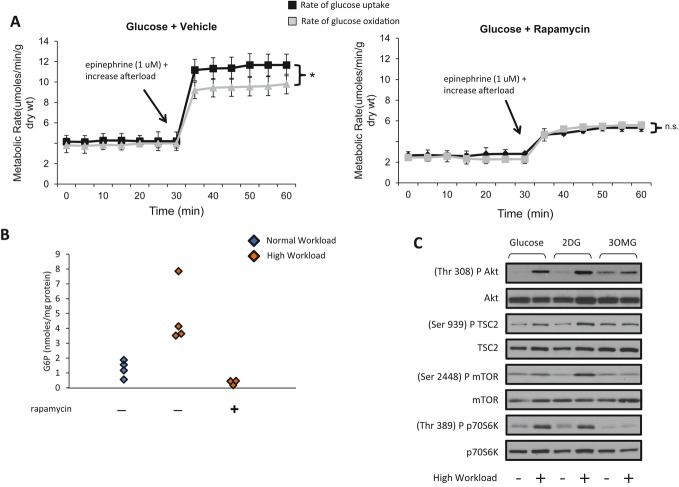
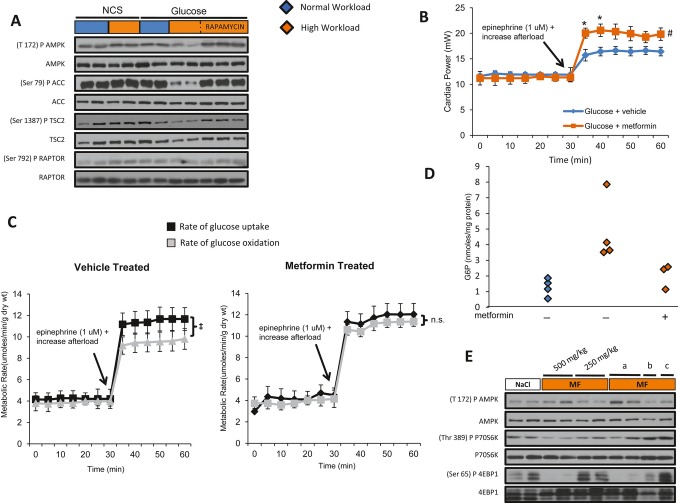
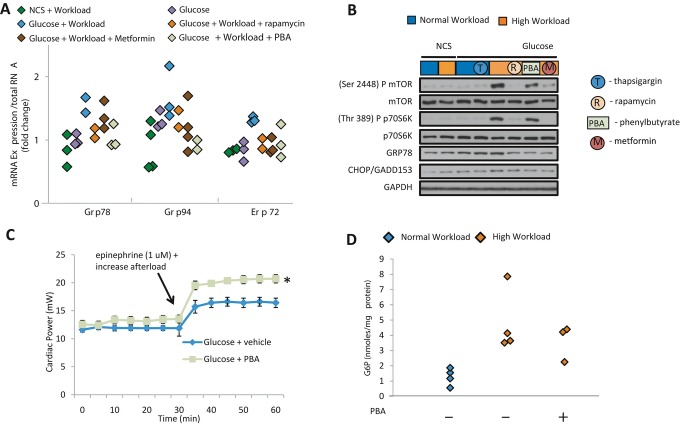
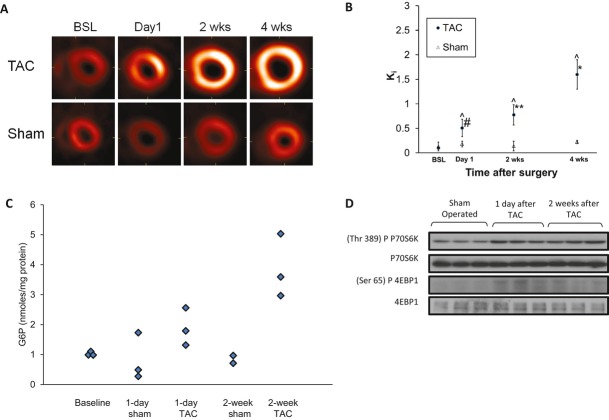
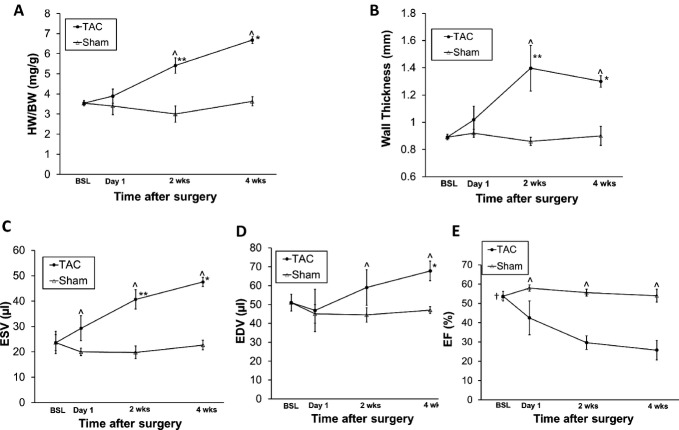
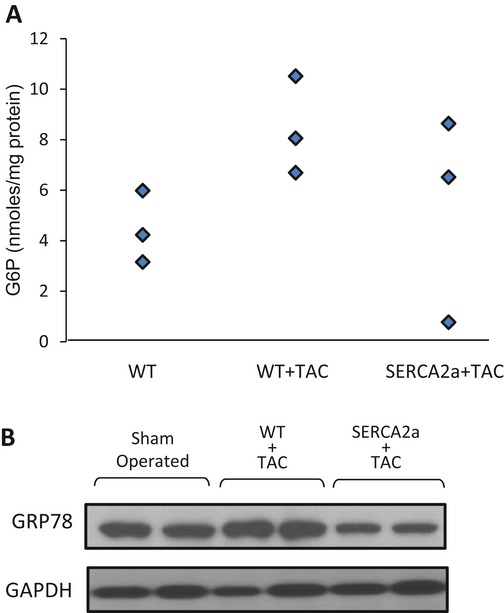
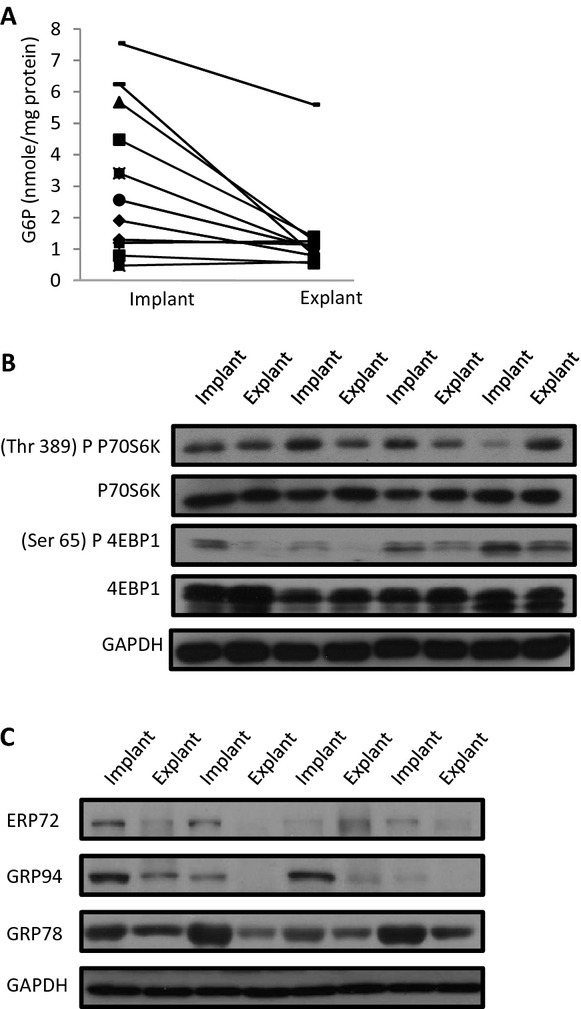
Methods and results: We subjected the working rat heart ex vivo to a high workload in the presence of different energy-providing substrates including glucose, glucose analogues, and noncarbohydrate substrates. We observed an association between G6P accumulation, mTOR activation, endoplasmic reticulum (ER) stress, and impaired contractile function, all of which were prevented by pretreating animals with rapamycin (mTOR inhibition) or metformin (AMPK activation). The histone deacetylase inhibitor 4-phenylbutyrate, which relieves ER stress, also improved contractile function. In contrast, adding the glucose analogue 2-deoxy-d-glucose, which is phosphorylated but not further metabolized, to the perfusate resulted in mTOR activation and contractile dysfunction. Next we tested our hypothesis in vivo by transverse aortic constriction in mice. Using a micro-PET system, we observed enhanced glucose tracer analog uptake and contractile dysfunction preceding dilatation of the left ventricle. In contrast, in hearts overexpressing SERCA2a, ER stress was reduced and contractile function was preserved with hypertrophy. Finally, we examined failing human hearts and found that mechanical unloading decreased G6P levels and ER stress markers.

Conclusions: We propose that glucose metabolic changes precede and regulate functional (and possibly also structural) remodeling of the heart. We implicate a critical role for G6P in load-induced mTOR activation and ER stress.

Keywords: ER stress; glucose; hypertrophy; mTOR; metabolism.


Figures

Figure 1.
Figure 1.
At high workload, glucose activates mTOR and impairs cardiac power in perfused rat hearts. Pretreatment of animals with rapamycin inhibits mTOR and rescues contractile function. A, Representative Western blots of the mTOR signaling pathway in hearts freeze‐clamped at the end of perfusion. High workload resulted in phosphorylation of PI3K and Akt in all hearts. For groups, protocols, and additions to the buffer, consult Table 1. However, phosphorylation of TSC2, mTOR, and p70S6K at high workload occurred only in the presence of glucose. Pretreating rats for 7 days with rapamycin (4 mg/kg per day) before perfusion of the heart resulted in decreased phosphorylation of Akt, TSC2, mTOR, and its downstream targets. B, At normal workload there was no difference in cardiac power among the 3 groups. At high workload the presence of the glucose substrate decreased cardiac power in hearts from vehicle‐treated rats. Pretreatment of rats with rapamycin for 7 days rescued cardiac performance in glucose‐perfused hearts. Data shown are mean±SEM; n=5 to 7 for each group. *P<0.05 (Mann–Whitney rank sum test) for hearts from vehicle‐treated rats perfused with glucose in comparison with hearts from vehicle‐treated rats perfused with NCS and those from rats pretreated with rapamycin and perfused with glucose at high workload. mTOR indicates mammalian target of rapamycin; TSC2, tuberin; NCS, noncarbohydrate substrate.
Figure 2.
Figure 2.
Pretreatment with rapamycin has no effect on cardiac efficiency in rat hearts perfused with glucose at high workload. A, Myocardial oxygen consumption (MVO2) at low and high workloads did not differ in hearts perfused with noncarbohydrate substrate (NCS) and in hearts from rats pretreated with vehicle or with rapamycin and perfused with glucose. B, Cardiac efficiency, as calculated by dividing cardiac power by MVO2, was also unchanged. The dot plots show individual measurements for each heart at 2 different workloads. Comparison within each group and between groups showed no significant difference (P>0.05).
Figure 3.
Figure 3.
Uncoupling protein 3 (UCP3) mRNA and protein levels are not associated with G6P‐mediated mammalian target of rapamycin (mTOR) activation. A, Transcript analysis of UCP3 gene expression in isolated working rat hearts. The dot plots show median values for n=2 to 3 rat hearts with 2 to 3 repeats per animal. P>0.05 for all comparisons based on Friedman test on repeated measurements of all hearts in each group compared with hearts perfused with noncarbohydrate substrate (NCS) at a normal workload. Neither workload nor glucose in the perfusate nor pretreatment of mice with rapamycin changed UCP3 mRNA expression at the end of perfusion. B, Compared with hearts perfused with NCS at a normal workload, neither workload, glucose, nor rapamycin pretreatment changed UCP3 protein levels.
Figure 4.
Figure 4.
In response to high workload, rates of glucose uptake exceed rates of glucose oxidation, hexose 6‐phosphate accumulates, and mTOR is activated. A, Rates of glucose uptake exceeded rates of glucose oxidation in hearts from rats pretreated with either vehicle or rapamycin and perfused at normal and high workloads. Pretreating rats with rapamycin significantly reduced rates of both glucose uptake and oxidation (right). Data shown are mean±SEM; n=5 to 6 per group. *P=0.07 with Mann–Whitney rank sum test. B, Glucose 6‐phosphate (G6P) levels in freeze‐clamped hearts. Subjecting hearts to high workload ex vivo induced a 4‐fold increase in average G6P levels, which was not observed when rats were pretreated with rapamycin. Dot plots show G6P levels for each heart. Kruskal–Wallis test yielded overall P=0.012. C, To test the hypothesis that hexose‐6‐phosphate (and no other glucose metabolite) activates mTOR, we also perfused hearts with NCS plus 2‐deoxyglucose or 3‐O‐methylglucose (see text for details). Representative Western blots of Akt, TSC2, mTOR and p70S6K phosphorylation from hearts perfused with glucose (5 mmol/L) or NCS plus the glucose analogues 2‐deoxyglucose (2DG; 5 mmol/L), or 3‐O‐methylglucose (3OMG; 5 mmol/L) at either normal or high workload are shown. Glucose or 2DG, but not 3OMG, increased phosphorylation of TSC2, mTOR, and p70S6K at high workload. mTOR indicates mammalian target of rapamycin; TSC2, tuberin; NCS, noncarbohydrate substrate.
Figure 5.
Figure 5.
In the presence of mixed substrates (glucose, NCS, and oleate), G6P levels are increased and mTOR signaling is activated at high workload. A, G6P accumulates in hearts perfused with glucose, oleate, and NCS (see Table 1 for substrate concentrations). Dot plot shows G6P levels for each heart at the end of perfusion at low or high workload; P=0.083 using Mann–Whitney test. B, Representative Western blots showing phosphorylation of mTOR targets p70S6K and 4EBP1 in ex vivo working rat (see Table 1 for details). Both glucose and mixed substrates in the perfusate increased p70S6K and 4EBP1 phosphorylation. NCS indicates noncarbohydrate substrate; mTOR, mammalian target of rapamycin; G6P, glucose 6‐phosphate.
Figure 6.
Figure 6.
G6P‐dependent mTOR activation is associated with downregulation of AMPK. A, Representative Western blots demonstrate reduction in phosphorylation of AMPK (T172) and ACC (S79), its downstream target, in hearts perfused with glucose at high workload. B, Contractile performance in the working heart perfused with glucose in the presence and absence of metformin. Data shown are mean±SEM; n=5 to 7 for each group. Metformin improves cardiac power at high workload. *P<0.05, #P=0.08, using Mann–Whitney rank sum test. C, Rates of glucose uptake and oxidation by hearts from animals receiving vehicle or metformin pretreatment for 7 days (vehicle treated, metformin treated). Data shown are mean±SEM; n=5 to 6 per group. Metformin treatment did not change rates of glucose uptake and oxidation at normal workload. At high workload, pretreating animals with metformin corrected the mismatch between rates of glucose uptake and oxidation. ‡P=0.021 using Mann–Whitney rank sum test. D, G6P levels in hearts from rats receiving either vehicle or metformin for 7 days before perfusion of their hearts with glucose as the only substrate. Dot plots of G6P show individual measurements for each heart at normal and high workloads. G6P accumulation was reduced in stressed hearts perfused with glucose in hearts of animals pretreated with metformin. Kruskal–Wallis test yielded an overall P=0.012. E, Representative Western blots demonstrating increased AMPK phosphorylation and decreased p70S6K as well as 4EBP1 phosphorylation in hearts from animals pretreated for 7 days with metformin (500 or 250 mg/kg) and perfused with glucose at high workload or in hearts from untreated animals perfused with glucose plus metformin at high workload. The concentrations of metformin in the perfusate were (a) 10 mmol/L, (b) 7.5 mmol/L, or (c) 5 mmol/L. Also see Table 1 for experimental detail. mTOR indicates mammalian target of rapamycin; AMPK, AMP kinase; ACC, acetyl‐CoA carboxylase; G6P, glucose 6‐phophate; MF, metformin.
Figure 7.
Figure 7.
Relief of ER stress improves contractile function in hearts perfused with glucose at high workload. A, Transcript analysis of ER stress response chaperones in isolated working rat hearts. Dot plot shows measurement of transcript levels of each ER stress marker with different treatment (n=2 to 3 for each group, with 2 to 3 repeats per heart). Hearts perfused with glucose at high workload showed a nearly 2‐fold average increase in markers of ER stress, which was not observed when animals were pretreated with rapamycin or metformin or when phenylbutyrate (PBA) was added to the perfusate. For details on groups, protocols, and additions to the buffer, see Table 1. Friedman test for ER stress (GRP78, GRP94, and ERP72) are 0.26, 0.10, and 0.71, respectively. B, Representative Western blots of mTOR, p70S6K, GRP78, and CHOP. Rapamycin or metformin inhibited mTOR signaling and lowered GRP78 protein. Adding PBA to perfusate lowered GRP78 levels independent of changes in mTOR signaling. Thapsigargin, an inhibitor of SERCA2a and a direct stress inducer for the ER, served as control. Taken together, these data suggest that the induction of ER stress in glucose‐perfused hearts at high workload requires mTOR activation and can be prevented by systemic rapamycin or metformin pretreatment. C, Effect of addition of PBA (10 mmol/L) to the perfusate on contractile performance of hearts perfused with glucose. Data shown are mean±SEM (n=5 to 8 for each group). PBA improved cardiac power at high workload. *P<0.004 using Mann–Whitney rank sum test. D, Effect of PBA on G6P accumulation in isolated working rat hearts. Dot plots of G6P levels are shown. Kruskal–Wallis test yielded an overall P=0.012, but comparison of G6P levels at high workload with or without metformin treatment was not statistically significant (P>0.05) using a Mann–Whitney test. ER indicates endoplasmic reticulum; NCS, noncarbohydrate substrate; mTOR, mammalian target of rapamycin.
Figure 8.
Figure 8.
Metabolic remodeling and mTOR activation precede structural remodeling in hearts subjected to high workload in vivo. A, Representative serial transverse, end‐diastolic PET slices for TAC and sham‐operated mice 1 day, 2 weeks, and 4 weeks after surgery. One day after TAC, there was an increase in FDG uptake that increased further over 4 weeks. B, Quantification of the rate of cardiac FDG uptake (Ki) of PET images from all TAC (n=8) and sham‐operated (n=5) mice. Data shown are mean±SEM. Ki in TAC mice demonstrated a 5‐fold increase in FDG uptake on day 1 and a 1.5‐ to 3.2‐fold increase from day 1 to 4 weeks. Sham‐operated mice showed no significant change in FDG uptake over 4 weeks. Comparisons at different times within TAC group: day 1 vs baseline (BSL), #P<0.05; 2 weeks vs BSL or day 1, **P<0.05; 4 weeks vs BSL, day 1, or 2 weeks, *P<0.001. Comparisons between TAC and sham groups at the same points, ^P<0.05. C, Tissue G6P levels in hearts after TAC or sham operation at baseline and after 1 day and 2 weeks. Dot plots of G6P levels for each group; n=6 for TAC and n=5 for sham. G6P levels were 2.3‐ and 4.6‐fold higher compared with sham‐operated animals 1 day and 2 weeks after TAC, respectively. Kruskal–Wallis test yielded overall P=0.0356. D, Representative Western blots demonstrated an increase in p70S6K and 4EBP1 phosphorylation 1 day and 2 weeks after TAC. mTOR indicates mammalian target of rapamycin; PET, positron emission tomography; TAC, transverse aortic constriction; FDG, 2‐deoxy, 2[18F]fluorodeoxy‐glucose.
Figure 9.
Figure 9.
In vivo structural and functional changes accompany metabolic changes in response to pressure overload. Data shown are mean±SEM; n=8 for TAC and n=5 for shams. A, Ratio of heart weight (HW) measured using MRI and body weight (BW). HW/BW ratio remained unchanged 1 day after TAC, but increased by 1.4‐ and 1.7‐fold between day 1 and 4 weeks, respectively. HW/BW showed no significant change over 4 weeks in sham‐operated mice. B, End‐diastolic wall thickness measured in vivo using MRI. Wall thickness was unchanged 1 day after TAC, but increased about 1.4‐fold between day 1 and 4 weeks. Wall thickness showed no significant change over 4 weeks in sham‐operated mice. End‐systolic volume (ESV; C), end‐diastolic volume (EDV; D), and resultant ejection fraction (EF; E) assessed in vivo using MRI imaging. An increase in ESV and decline in EF occurred 1 day after TAC. Sham‐operated mice exhibited no significant change in EDV, ESV, and EF over 4 weeks. Comparisons at different times in the TAC group: day 1 vs baseline (BSL), #P<0.05; 2 weeks vs BSL or day 1, **P<0.05; 4 weeks vs BSL or day 1, *P<0.01; BSL vs day 1, 2 weeks, and 4 weeks, †P<0.05. Comparisons between TAC and sham groups at the same points, ^P<0.05. Two‐way repeated‐measures ANOVA analyzed, and Holm‐Sidak post hoc test performed to obtain individual significance factors. TAC indicates transverse aortic constriction; MRI, magnetic resonance imaging; ANOVA, analysis of variance.
Figure 10.
Figure 10.
Cardiac‐specific SERCA2a overexpression reduces intracardiac G6P and decreases markers of ER stress in mice subjected to TAC in vivo. A, Effects of SERCA2a overexpression on tissue G6P levels in TAC mice. G6P levels were 1.9‐fold higher on average in WT+TAC than in WT−TAC. SERCA2a overexpression slightly reduced G6P accumulation in hearts subjected to TAC. Dot plot of G6P levels (n=3 for each group). Kruskal–Wallis test yielded an overall P=0.15. B, Representative Western blots demonstrated an increase in GRP78 protein expression in WT+TAC, which was reduced with SERCA2a overexpression (n=6 for each group). In vivo contractile performance, assessed by echocardiography, was improved in SERCA2a+TAC compared with WT+TAC (data not shown). ER indicates endoplasmic reticulum; WT, wild type; G6P, glucose 6‐phosphate; TAC, transverse aortic constriction.
Figure 11.
Figure 11.
Mechanical unloading of failing human hearts results in reduced G6P accumulation, reduced mTOR activation, and reduced ER stress markers. A, Tissue G6P levels for individual patients with idiopathic dilated cardiomyopathy before and after mechanical unloading; n=11 paired samples, P<0.05 using paired t test. B, Representative Western blots of p70S6K and 4EBP1 before and after mechanical unloading. C, Representative (each “implant” and “explant” refers to 1 patient's heart—4 patients total) Western blots of markers of ER stress (ERP72, GRP94, GRP78) before and after mechanical unloading. G6P indicates glucose 6‐phosphate; ER, endoplasmic reticulum; mTOR, mammalian target of rapamycin.
Figure 12.
Figure 12.
Proposed mechanism by which G6P accumulation regulates load‐induced mTOR activation and ER stress. The intersections of the metabolic pathway of glucose transport and phosphorylation with the molecular signaling pathways addressed in the study are shown. We propose that rapamycin (mTOR inhibition), metformin (AMPK activation), phenylbutyrate (ER stress relief), or LVAD (mechanical unloading) protect the heart from metabolic stress at high workload. G6P indicates glucose‐6‐phosphate; mTOR, mammalian target of rapamycin; ER, endoplasmic reticulum; AMPK, AMP kinase; LVAD, left ventricular assist device; HK, hexokinase; TSC, or tuberous sclerosis complex, is composed of TSC1 (hamartin) and TSC2 (tuberin).

References

    1. Goodwin GW, Taylor CS, Taegtmeyer H. Regulation of energy metabolism of the heart during acute increase in heart work. J Biol Chem. 1998; 273:29530-29539 - PubMed
    1. Bishop S, Altschuld R. Increased glycolytic metabolism in cardiac hypertrophy and congestive heart failure. Am J Physiol. 1970; 218:153-159 - PubMed
    1. Dorn GW, II, Force T. Protein kinase cascades in the regulation of cardiac hypertrophy. J Clin Invest. 2005; 115:527-537 - PMC - PubMed
    1. Taegtmeyer H, Overturf ML. Effects of moderate hypertension on cardiac function and metabolism in the rabbit. Hypertension. 1988; 11:416-426 - PubMed
    1. Sharma S, Guthrie PH, Chan SS, Haq S, Taegtmeyer H. Glucose phosphorylation is required for insulin‐dependent mTOR signalling in the heart. Cardiovasc Res. 2007; 76:71-80 - PMC - PubMed

Publication types

LinkOut - more resources