. 2013 Jun 15;190(12):6180-6.
doi: 10.4049/jimmunol.1300181. Epub 2013 May 17.

Recent thymic emigrants and mature naive T cells exhibit differential DNA methylation at key cytokine loci

Affiliations

Recent thymic emigrants and mature naive T cells exhibit differential DNA methylation at key cytokine loci

Amy M Berkley et al. J Immunol. .

Abstract

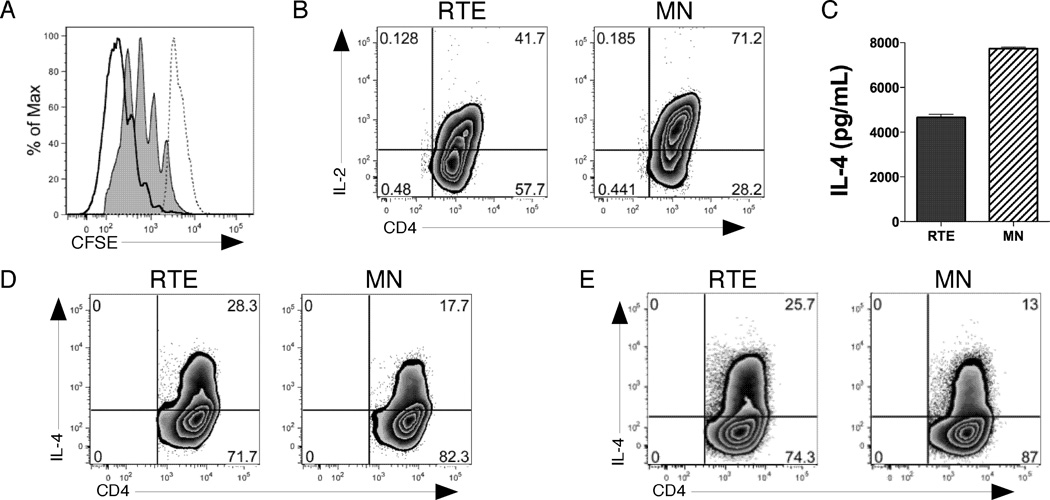
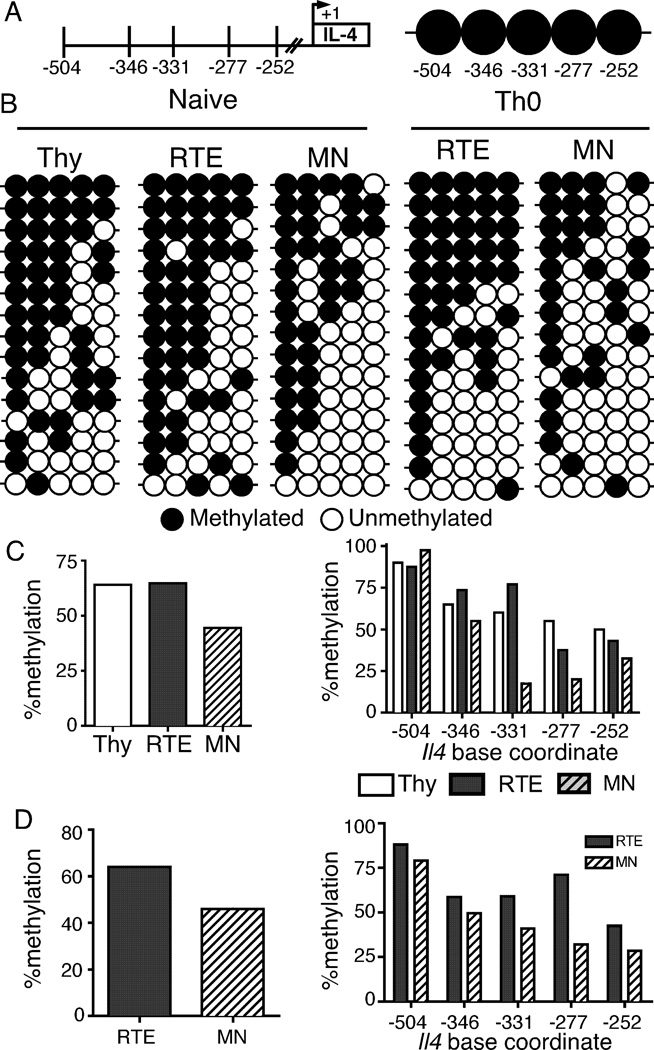
Recent thymic emigrants (RTEs) are the youngest T cells in the lymphoid periphery and exhibit phenotypic and functional characteristics distinct from those of their more mature counterparts in the naive peripheral T cell pool. We show in this study that the Il2 and Il4 promoter regions of naive CD4(+) RTEs are characterized by site-specific hypermethylation compared with those of both mature naive (MN) T cells and the thymocyte precursors of RTEs. Thus, RTEs do not merely occupy a midpoint between the thymus and the mature T cell pool, but represent a distinct transitional T cell population. Furthermore, RTEs and MN T cells exhibit distinct CpG DNA methylation patterns both before and after activation. Compared with MN T cells, RTEs express higher levels of several enzymes that modify DNA methylation, and inhibiting methylation during culture allows RTEs to reach MN T cell levels of cytokine production. Collectively, these data suggest that the functional differences that distinguish RTEs from MN T cells are influenced by epigenetic mechanisms and provide clues to a mechanistic basis for postthymic maturation.


Figures

Figure 1
Figure 1. Distinct methylation patterns at the Il2 promoter in adult CD4+ RTEs
DNA methylation analysis for 4 sites in the Il2 promoter with sodium bisulfite-treated genomic DNA from mature (GFP+TCRβ+ CD69lo) CD4+ SP thymocytes (Thy) and naïve and 3 d Th0-activated CD4+ RTEs and MN T cells. A) The 4 CpG sites analyzed upstream of the transcription start site, represented as circles and shown in order from promoter distal to proximal. B) Each row represents a cloned and sequenced allele. At least 30 clones from each population were sequenced per round, of which 15 are shown. For naïve (C) and Th0-activated samples (D), graphs show the % methylation for all CpG sites (left) or at each individual site (right) in mature thymocytes, RTEs and MN T cells. Data are compiled from at least 3 experiments per group, and include biological replicates.
Figure 2
Figure 2. CD4 RTEs and MN T cells subjected to bisulfite genomic sequencing are functionally distinct
CFSE-labeled CD4+ RTEs and MN T cells were activated under Th0 conditions for 3 d or Th2 conditions for 3 or 5 d and cytokine production measured by intracellular staining or ELISA. A) Histograms show CFSE dilution by non-activated (dotted line) and 3 d Th0-activated RTEs (shaded) and MN T cells (solid line). B) IL-2 and C) IL-4 production by Th0-activated RTEs and MN T cells. IL-4 production by Th2-activated RTEs and MN T cells at D) 3 and E) 5 d. Similar analyses were performed on each of the samples subjected to bisulfite genomic sequencing. An unpaired Student’s t test was used to calculate p values. For differences between RTEs and MN T cells in proliferation and IL-2 and IL-4 secretion, p<0.01 under Th0 conditions and p<0.001 under Th2 conditions in data compiled from 4 independent experiments.
Figure 3
Figure 3. Distinct methylation patterns at the Il4 promoter in adult RTEs directly ex vivo
DNA methylation analysis for 5 sites in the Il4 promoter with sodium bisulfite-treated genomic DNA from mature (GFP+TCRβ+ CD69lo) CD4+ SP thymocytes (Thy) and naïve and 3 d Th0-activated CD4+ RTEs and MN T cells. A) The 5 CpG sites analyzed upstream of the transcription start site. B) At least 26 clones from each population were sequenced per round, of which 15 are shown. For naïve (C) and Th0-activated samples (D), graphs show the % methylation for all CpG sites (left) or at each individual site (right). Data are compiled from at least 3 experiments per group, and include biological replicates.
Figure 4
Figure 4. Th2 differentiation of adult RTEs drives progressive Il4 promoter demethylation
DNA methylation analysis for 5 sites with sodium bisulfite-treated genomic DNA from CD4+ RTEs and MN T cells stimulated under Th2 conditions. A) Graphs show the % methylation for all CpG sites in RTEs and MN T cells at days 3 and 5. At least 26 clones from each population were sequenced per round. B) Data from naïve (Figure 3) and Th2 clones were graphed to show the % methylation at each CpG site in the Il4 promoter in RTEs and MN T cells during Th2 differentiation. Data are compiled from at least 3 experiments per group, and include biological replicates.
Figure 5
Figure 5. Similar cytokine production by Th0 activated RTEs and MN T cells after inhibition of methylation
CD4+ RTEs and MN T cells were CFSE-labeled and activated under Th0 conditions for 3 d in the presence or absence of 5-azacytidine (5–aza). A) IL-2 production as measured by ELISA. B) IL-4 production as measured by ELISA. C) Percentage of cells that have divided one or more times by d 3 of activation, as measured by CFSE dilution. Data are mean±SEM and are compiled from at least 3 independent experiments. An unpaired Student’s t test was used to calculate p values: *, p<.05; **, p<.005, NS = not significant.
Figure 6
Figure 6. Differential DNA methyltransferase and demethylase expression by CD4+ RTEs and MN T cells
A) Quantitative RT-PCR for Dnmt1, Dnmt3a, Dnmt3b, and Tet1 was performed on mRNA from mature (GFP+TCRβ+CD69lo) CD4+ SP thymocytes (Thy), and CD4+ RTEs and MN T cells. Data are from triplicate reactions normalized to an internal HPRT control, and are compiled from 2–3 biological samples. Bars represent mean±SEM. An unpaired Student’s t test was used to calculate p values: *, p<.05; **, p<.005. B) Flow cytometric analysis of DNMT1, DNMT3a, and DNMT3b protein expression in mature (GFP+TCRβ+CD62Lhi) CD4+ SP thymocytes (Thy), CD4+ RTEs and MN T cells. Histograms show data representative of 4 or more experiments. Shaded histogram represents secondary stain without primary antibody. Graphs depict mean±SEM of mean fluorescence intensity (MFI) of stained/background samples, compiled from all experiments. A paired Student’s t test was used to calculate p values: *, p<.05; **, p<.005. Utility of the DNMT antibodies for flow cytometry was validated by quantifying the activation-induced DNMT expression by CD4+ T cells by Western analysis and confirming it recapitulated the flow cytometric data.

References

    1. Fink PJ, Hendricks DW. Post-thymic maturation: young T cells assert their individuality. Nat. Rev. Immunol. 2011;11:544–548. - PMC - PubMed
    1. Fink PJ. The biology of recent thymic emigrants. Annu. Rev. Immunol. 2013;31:31–50. - PubMed
    1. Boursalian TE, Golub J, Soper DM, Cooper CJ, Fink PJ. Continued maturation of thymic emigrants in the periphery. Nat. Immunol. 2004;5:418–425. - PubMed
    1. Haines CJ, Giffon TD, Lu LS, Lu X, Lavigne-Tessier M, Ross DT, Lewis DB. Human CD4+ T cell recent thymic emigrants are identified by protein tyrosine kinase 7 and have reduced immune function. J. Exp. Med. 2009;206:275–285. - PMC - PubMed
    1. Hendricks DW, Fink PJ. Recent thymic emigrants are biased against the T-helper type 1 and toward the T-helper type 2 effector lineage. Blood. 2011;117:1239–1249. - PMC - PubMed

Publication types

MeSH terms