. 2013 Sep;91(9):1143-51.
doi: 10.1002/jnr.23242. Epub 2013 May 17.

Microglia express distinct M1 and M2 phenotypic markers in the postnatal and adult central nervous system in male and female mice

Affiliations

Microglia express distinct M1 and M2 phenotypic markers in the postnatal and adult central nervous system in male and female mice

Jessica M Crain et al. J Neurosci Res. 2013 Sep.

Abstract

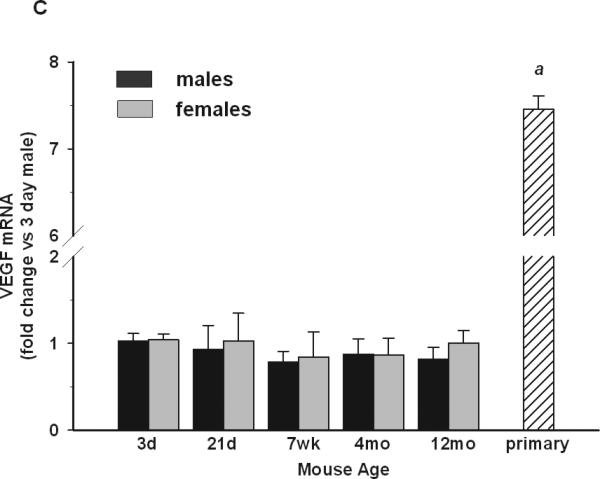
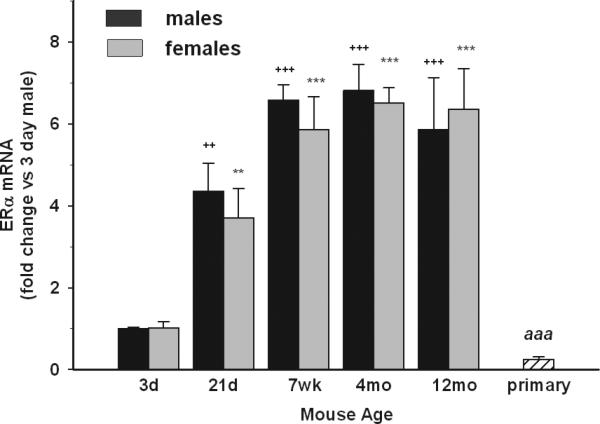
Although microglial activation is associated with all CNS disorders, many of which are sexually dimorphic or age-dependent, little is known about whether microglial basal gene expression is altered with age in the healthy CNS or whether it is sex dependent. Analysis of microglia from the brains of 3-day (P3)- to 12-month-old male and female C57Bl/6 mice revealed distinct gene expression profiles during postnatal development that differ significantly from those in adulthood. Microglia at P3 are characterized by relatively high iNOS, TNFα and arginase-I mRNA levels, whereas P21 microglia have increased expression of CD11b, TLR4, and FcRγI. Adult microglia (2-4 months) are characterized by low proinflammatory cytokine expression, which increases by 12 months of age. Age-dependent differences in gene expression suggest that microglia likely undergo phenotypic changes during ontogenesis, although in the healthy brain they did not express exclusively either M1 or M2 phenotypic markers at any time. Interestingly, microglia were sexually dimorphic only at P3, when females had higher expression of inflammatory cytokines than males, although there were no sex differences in estrogen receptor expression at this or any other time evaluated here. Compared with microglia in vivo, primary microglia prepared from P3 mice had considerably altered gene expression, with higher levels of TNFα, CD11b, arginase-I, and VEGF, suggesting that culturing may significantly alter microglial properties. In conclusion, age- and sex-specific variances in basal gene expression may allow differential microglial responses to the same stimulus at different ages, perhaps contributing to altered CNS vulnerabilities and/or disease courses.

Keywords: M1/M2 phenotype; aging; development; microglia; sexual dimorphism.


Figures

Fig. 1
Fig. 1. Basal expression of pro-inflammatory genes in microglia
The expression of iNOS (A) and TNFα (B), but not IL-1β (C), was significantly higher in microglia isolated from whole brains of 3-day old mice. On the contrary, IL-6 (D) expression was lowest at P3 compared to other ages. Females had higher expression of TNFα, IL-1β and IL-6 than males at P3. Gene expression in primary microglia was significantly affected by culturing in vitro. Gene expression data are expressed as fold change relative to 3 day-old males. + depicts significant age-dependent differences vs. 3 day-old males. * depicts significant age-dependent differences vs. 3 day-old females. # depicts significant differences between males and females of the same age. Symbol “a” depicts significant difference in gene expression in primary microglia vs. 3 day-old males. The number of symbols corresponds to the following p-values: *p<0.05; **p<0.01; ***p<0.001. N.D., not determined.
Fig 2
Fig 2. Basal expression of anti-inflammatory and trophic factor genes in microglia
P3 females had higher microglial expression of IL-10 (A) than males. Arginase-I (B) expression was highest at P3 both in males and females compared to other ages. There were no sex- or age-dependent changes in VEGF (C) expression. Primary microglia cultures had significantly lower expression of IL-10 compared to males or females in vivo, whereas VEGF was significantly upregulated compared to any age or sex in vivo. Gene expression data are expressed as fold change relative to 3 day-old males. + depicts significant age-dependent differences vs. 3 day-old males. * depicts significant age-dependent differences vs. 3 day-old females. # depicts significant differences between males and females of the same age. Symbol “a” depicts significant difference in gene expression in primary microglia vs. 3 day-old males. The number of symbols corresponds to the following p-values: *p<0.05; **p<0.01; ***p<0.001
Fig 3
Fig 3. Basal expression of membrane proteins in microglia
P21 microglia were characterized by elevated expression of TLR4 (A), FcRγI (C) and CD11b (D), but not TLR2 (B) compared to other ages. Interestingly, primary microglial cells had elevated CD11b levels compared to male or female P3 pups in vivo. Gene expression data are expressed as fold change relative to 3 dayold males. + depicts significant age-dependent differences vs. 3 day-old males. * depicts significant age-dependent differences vs. 3 day-old females. # depicts significant differences between males and females of the same age. Symbol “a” depicts significant difference in gene expression in primary microglia vs. 3 day-old males. The number of symbols corresponds to the following p-values: *p<0.05; **p<0.01; ***p<0.001.
Fig 4
Fig 4. Basal expression of estrogen receptors in microglia
The expression levels of ERα and ERβ were evaluated by qRT-PCR and are expressed as fold change relative to 3 day-old males. P3 male and female microglia had the lowest expression of ERα compared to other ages. No sex-dependent differences were detected in ERα expression at any age. Primary microglia had downregulated ERα levels compared to P3 male and female microglia in vivo. ERβ was undetectable in all ages. + depicts significant age-dependent differences vs. 3 day-old males. * depicts significant age-dependent differences vs. 3 day-old females. # depicts significant differences between males and females of the same age. Symbol “a” depicts significant difference in gene expression in primary microglia vs. 3 day-old males. The number of symbols corresponds to the following p-values: *p<0.05; **p<0.01; ***p<0.001.

Similar articles

Cited by

References

    1. Arevalo MA, Diz-Chaves Y, Santos-Galindo M, Bellini MJ, Garcia-Segura LM. Selective oestrogen receptor modulators decrease the inflammatory response of glial cells. Journal of neuroendocrinology. 2012;24(1):183–190. - PubMed
    1. Baker AE, Brautigam VM, Watters JJ. Estrogen modulates microglial inflammatory mediator production via interactions with estrogen receptor beta. Endocrinology. 2004;145(11):5021–5032. - PubMed
    1. Balthazart J, Ball GF. New insights into the regulation and function of brain estrogen synthase (aromatase). Trends Neurosci. 1998;21(6):243–249. - PubMed
    1. Bansal V, Ochoa JB. Arginine availability, arginase, and the immune response. Current opinion in clinical nutrition and metabolic care. 2003;6(2):223–228. - PubMed
    1. Bloch GJ, Kurth SM, Akesson TR, Micevych PE. Estrogen-concentrating cells within cell groups of the medial preoptic area: sex differences and co-localization with galanin-immunoreactive cells. Brain Res. 1992;595(2):301–308. - PubMed

Publication types

MeSH terms