. 2013 Oct;74(4):602-10.
doi: 10.1002/ana.23939. Epub 2013 Sep 16.

Validation of midbrain positron emission tomography measures for nigrostriatal neurons in macaques

Affiliations

Validation of midbrain positron emission tomography measures for nigrostriatal neurons in macaques

Christopher A Brown et al. Ann Neurol. 2013 Oct.

Abstract

Objective: Development of an effective therapy to slow the inexorable progression of Parkinson disease requires a reliable, objective measurement of disease severity. In the present study, we compare presynaptic positron emission tomography (PET) tracer uptake in the substantia nigra (SN) to cell loss and motor impairment in 1-methyl-4-phenyl-1,2,3,6-tetrahydropyridine (MPTP)-treated nonhuman primates.

Methods: Presynaptic PET tracers 6-[(18)F]-fluorodopa (FD), [(11)C]-2β-methoxy-3β-4-fluorophenyltropane (CFT), and [(11)C]-dihydrotetrabenazine (DTBZ) were used to measure specific uptake in the SN and striatum before and after a variable dose of MPTP in nonhuman primates. These in vivo PET-based measures were compared with motor impairment, as well as postmortem tyrosine hydroxylase-positive cell counts and striatal dopamine concentration.

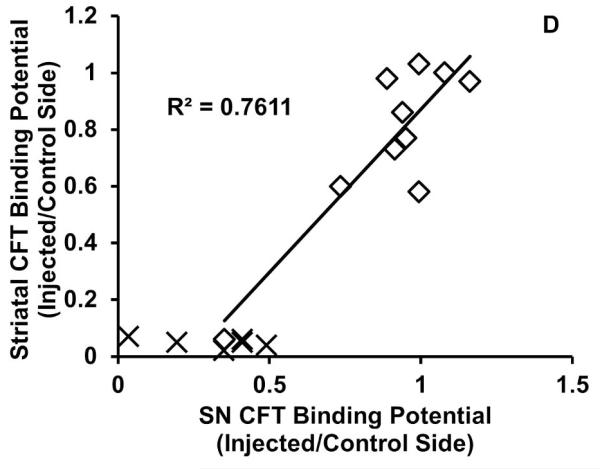
Results: We found the specific uptake of both CFT and DTBZ in the SN had a strong, significant correlation with dopaminergic cell counts in the SN (R(2) = 0.77, 0.53, respectively, p < 0.001), but uptake of FD did not. Additionally, both CFT and DTBZ specific uptake in the SN had a linear relationship with motor impairment (rs = -0.77, -0.71, respectively, p < 0.001), but FD uptake did not.

Interpretation: Our findings demonstrate that PET-measured binding potentials for CFT and DTBZ for a midbrain volume of interest targeted at the SN provide faithful correlates of nigral neuronal counts across a full range of lesion severity. Because these measures correlate with both nigral cell counts and parkinsonian ratings, we suggest that these SN PET measures are relevant biomarkers of nigrostriatal function.


Figures

Figure 1
Figure 1
The midbrain VOIs outline in red and white on a transverse T1-weighted slice with high contrast. The regions surround the slight hyper-intensity between the hypo-intense reticulata (SNr) and red nucleus (RN). The medial border is the relatively hyper-intense oculomotor nerves just dorsolateral to the interpeduncular cistern (IC), and the lateral border is the SNr.
Figure 2
Figure 2
The relationship between injected/control side MPTP BPND of CFT and DTBZ. Each data point represents one monkey and the trend line is the linear fit of the data. There was a wide distribution of data and tight linear relationship.
Figure 3
Figure 3
The relationship between CFT (A),DTBZ (B), and FD (C) injected/control side BPND (or Kocc) in the SN and injected/control side ratio of TH+ neurons in the SN. Each data point represents one monkey and the trend lines are the linear fits of the data. CFT and DTBZ exhibited a tight linear correlation with residual cells in the SN.
Figure 3
Figure 3
The relationship between CFT (A),DTBZ (B), and FD (C) injected/control side BPND (or Kocc) in the SN and injected/control side ratio of TH+ neurons in the SN. Each data point represents one monkey and the trend lines are the linear fits of the data. CFT and DTBZ exhibited a tight linear correlation with residual cells in the SN.
Figure 4
Figure 4
The relationship between injected/control side SN BPND or Kocc for each tracer and injected/control side striatal dopamine concentration (a-c) or striatal BPND or Kocc of the same tracer (d-f). Each data point represents one monkey. Trend lines are the linear fit of data points other than X, which were primates with ≥50% cell loss. Both striatal dopamine and striatal PET measures had a flooring effect after >50% cell loss, and SN BPND only showed a linear fit when <50% nigral cell loss occurred.
Figure 4
Figure 4
The relationship between injected/control side SN BPND or Kocc for each tracer and injected/control side striatal dopamine concentration (a-c) or striatal BPND or Kocc of the same tracer (d-f). Each data point represents one monkey. Trend lines are the linear fit of data points other than X, which were primates with ≥50% cell loss. Both striatal dopamine and striatal PET measures had a flooring effect after >50% cell loss, and SN BPND only showed a linear fit when <50% nigral cell loss occurred.
Figure 5
Figure 5
The relationship between CFT (top) and DTBZ (bottom) injected/control side BPND in the SN and final motor score. Each data point represents one monkey and the trend lines are the linear fits of the data. Both CFT and DTBZ had a tight linear relationship with motor scores across a wide range of lesion severity and motor impairment.
Figure 5
Figure 5
The relationship between CFT (top) and DTBZ (bottom) injected/control side BPND in the SN and final motor score. Each data point represents one monkey and the trend lines are the linear fits of the data. Both CFT and DTBZ had a tight linear relationship with motor scores across a wide range of lesion severity and motor impairment.

References

    1. Tabbal SD, Tian LL, Karimi MK, Brown CA, et al. Low nigrostriatal reserve for motor parkinsonism in nonhuman primates. Exp Neuro. 2012;237:355–362. - PMC - PubMed
    1. The Parkinson Study Group Levodopa and the Progression of Parkinson’s Disease. NEJM. 2004;351:2498–2508. - PubMed
    1. Whone AL, Watts RL, Stoessl AJ, Davis M, et al. Slower progression of Parkinson’s disease with ropinirole versus levodopa: The REAL-PET study. Ann Neurol. 2003;54:93–101. - PubMed
    1. Lang AE, Gill S, Patel NK, Lozano A, et al. Randomized controlled trial of intraputamenal glial cell line-derived neurotrophic factor infusion in Parkinson disease. Ann Neurol. 2006;59:459–466. - PubMed
    1. Ravina B, Eidelberg D, Ahlskog JE, Albin RL, et al. The role of radiotracer imaging in Parkinson disease. Neurol. 2005;64:208–215. - PubMed

Publication types

LinkOut - more resources