

Lipoic acid suppresses portal endotoxemia-induced steatohepatitis and pancreatic inflammation in rats
- PMID: 23687413
- PMCID: PMC3653150
- DOI: 10.3748/wjg.v19.i18.2761
Lipoic acid suppresses portal endotoxemia-induced steatohepatitis and pancreatic inflammation in rats
Abstract
Aim: To examine the effect of α-lipoic acid (LA) on mild portal endotoxemia-induced steatohepatitis and associated pancreatic abnormalities in fructose-fed rats.
Methods: Rats were randomly assigned into two groups with a regular or 60% fructose-enriched diet for 8 wk. After fructose feeding for 4 wk, rats were further divided into four subgroups: with intraportal saline (FPV), with intraportal saline plus administration of LA (FPV + LA), with lipopolysaccharide (LPS) infusion (FPLPS), and with LPS infusion plus administration of LA (FPLPS + LA). Rats were treated with LPS using intraportal infusion while LA was administered orally. Metabolite levels, superoxide levels, inflammatory markers, malondialdehyde content, glutathione content and toll-like receptor 4 (TLR4) gene expression were all measured using standard biochemical techniques. Pancreatic insulin secretion was evaluated by a hyperglycemic clamp technique. Histology of liver and pancreas tissues were evaluated using hematoxylin and eosin staining and immunohistochemistry.
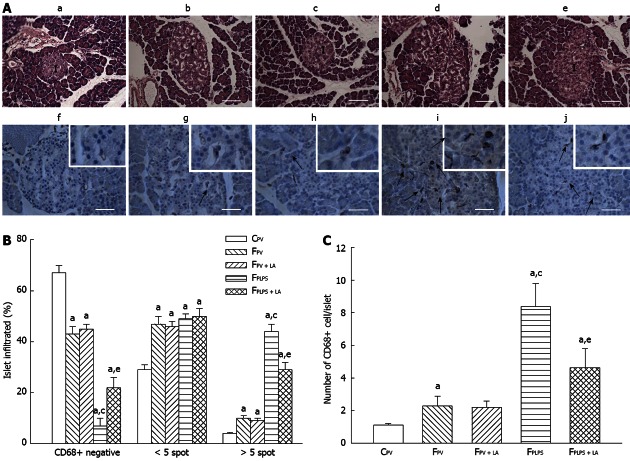
Results: Fructose-induced elevation in plasma C-reactive protein, amylase, superoxide, white blood cell count as well as in hepatic and pancreatic contents of malondialdehyde, tumor necrosis factor alpha and interleukin-6 were increased in animals treated with LPS and reversed with LA administration. The augmented hepatic gene expression of TLR4 in fructose-fed rats was further increased in those with intraportal LPS infusion, which was partially reversed by LA administration. Pathological examination showed inflammatory changes and leukocyte infiltration in hepatic and pancreatic islets of animals treated with LPS but were rarely observed in those with LA treatment. In addition to affects on the liver, impaired pancreatic insulin secretion seen in fructose-fed rats was deteriorated in with LPS treatment and partially reversed with LA administration.
Conclusion: These data suggest LA could significantly suppress mild portal-endotoxemia but not fructose-induced liver and pancreatic abnormalities in a rodent model for metabolic syndrome.
Keywords: Fructose; Insulin secretion; Lipoic acid; Oxidative stress; Portal endotoxemia; Steatohepatitis.
Figures


Similar articles
-
α-Lipoic acid prevents mild portal endotoxaemia-induced hepatic inflammation and β cell dysfunction.Eur J Clin Invest. 2012 Jun;42(6):637-48. doi: 10.1111/j.1365-2362.2011.02630.x. Epub 2011 Nov 29. Eur J Clin Invest. 2012. PMID: 22121883
-
Inflammatory change of fatty liver induced by intraportal low-dose lipopolysaccharide infusion deteriorates pancreatic insulin secretion in fructose-induced insulin-resistant rats.Liver Int. 2008 Sep;28(8):1167-75. doi: 10.1111/j.1478-3231.2008.01714.x. Epub 2008 Apr 7. Liver Int. 2008. PMID: 18397237
-
Mild portal endotoxaemia induces subacute hepatic inflammation and pancreatic beta-cell dysfunction in rats.Eur J Clin Invest. 2008 Sep;38(9):640-8. doi: 10.1111/j.1365-2362.2008.01991.x. Eur J Clin Invest. 2008. PMID: 18837740
-
Endotoxemia in newborn rats attenuates acute pancreatitis at adult age.J Physiol Pharmacol. 2007 Mar;58(1):131-47. J Physiol Pharmacol. 2007. PMID: 17440232
-
Metabolic endotoxemia with obesity: Is it real and is it relevant?Biochimie. 2016 May;124:11-20. doi: 10.1016/j.biochi.2015.06.020. Epub 2015 Jun 29. Biochimie. 2016. PMID: 26133659 Free PMC article. Review.
Cited by
-
The protective effect of lipoic acid on selected cardiovascular diseases caused by age-related oxidative stress.Oxid Med Cell Longev. 2015;2015:313021. doi: 10.1155/2015/313021. Epub 2015 Apr 8. Oxid Med Cell Longev. 2015. PMID: 25949771 Free PMC article. Review.
-
Lipoic acid in metabolic dysfunction-associated steatotic liver disease: a review.Nutr Metab (Lond). 2025 Jun 7;22(1):56. doi: 10.1186/s12986-025-00954-9. Nutr Metab (Lond). 2025. PMID: 40483465 Free PMC article. Review.
-
The Protective Role of Prenatal Alpha Lipoic Acid Supplementation against Pancreatic Oxidative Damage in Offspring of Valproic Acid-Treated Rats: Histological and Molecular Study.Biology (Basel). 2020 Aug 20;9(9):239. doi: 10.3390/biology9090239. Biology (Basel). 2020. PMID: 32825436 Free PMC article.
-
Experimental models of non-alcoholic fatty liver disease in rats.World J Gastroenterol. 2014 Jul 14;20(26):8364-76. doi: 10.3748/wjg.v20.i26.8364. World J Gastroenterol. 2014. PMID: 25024595 Free PMC article.
-
High Dietary Fructose: Direct or Indirect Dangerous Factors Disturbing Tissue and Organ Functions.Nutrients. 2017 Mar 29;9(4):335. doi: 10.3390/nu9040335. Nutrients. 2017. PMID: 28353649 Free PMC article. Review.
References
-
- Marchesini G, Marzocchi R. Metabolic syndrome and NASH. Clin Liver Dis. 2007;11:105–117. - PubMed
-
- Moscatiello S, Di Luzio R, Sasdelli AS, Marchesini G. Managing the combination of nonalcoholic fatty liver disease and metabolic syndrome. Expert Opin Pharmacother. 2011;12:2657–2672. - PubMed
-
- Gambino R, Musso G, Cassader M. Redox balance in the pathogenesis of nonalcoholic fatty liver disease: mechanisms and therapeutic opportunities. Antioxid Redox Signal. 2011;15:1325–1365. - PubMed
-
- Hsieh PS. Inflammatory change of fatty liver induced by intraportal low-dose lipopolysaccharide infusion deteriorates pancreatic insulin secretion in fructose-induced insulin-resistant rats. Liver Int. 2008;28:1167–1175. - PubMed
Publication types
MeSH terms
Substances
LinkOut - more resources
Full Text Sources
Other Literature Sources
Medical
Research Materials
