

Phenotypic map of porcine retinal ganglion cells
- PMID: 23687427
- PMCID: PMC3654859
Phenotypic map of porcine retinal ganglion cells
Abstract
Purpose: Porcine retina is an excellent model for studying diverse retinal processes and diseases. The morphologies of porcine retinal ganglion cells (RGCs) have, however, not yet been described comprehensively. The aim of the present study was to créate a classification of the RGCs using the 1, 1'-dioctadecyl-3,3,3',3'-tetramethylindocarbocyanine perchlorate (DiI) tracing method.
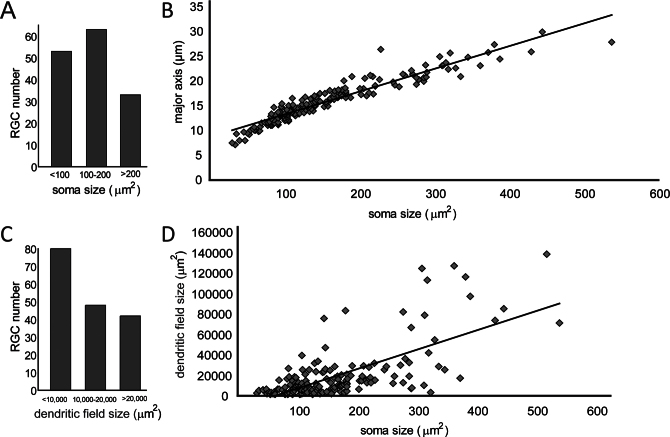
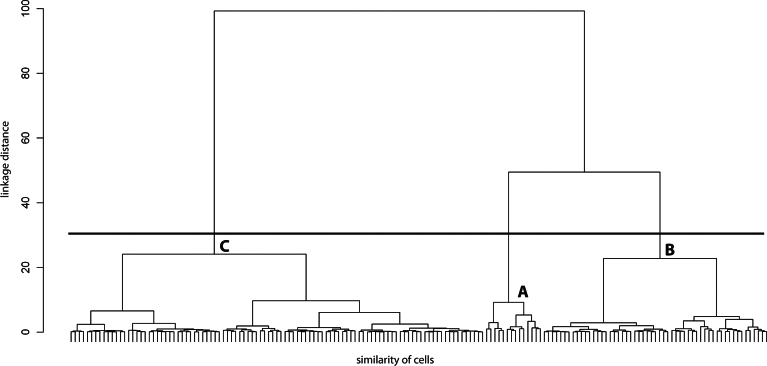
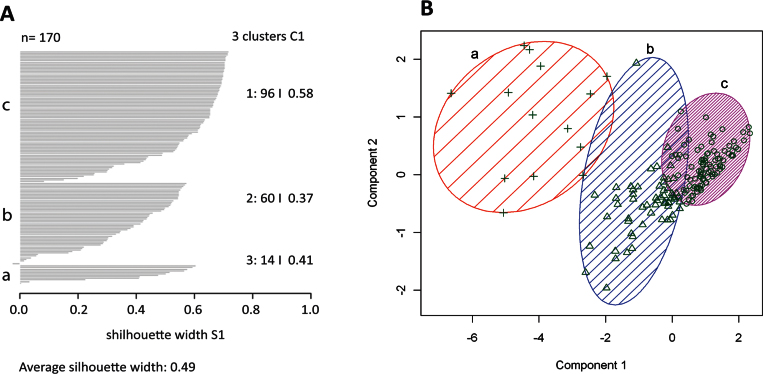
Methods: About 170 RGCs were retrogradely labeled by injecting DiI into the optic nerve of postmortem eyes and statistically analyzed by two different clustering methods: Ward's algorithm and the K-means clustering. Major axis length of the soma, soma area size, and dendritic field area size were selected as main parameters for cluster classification.
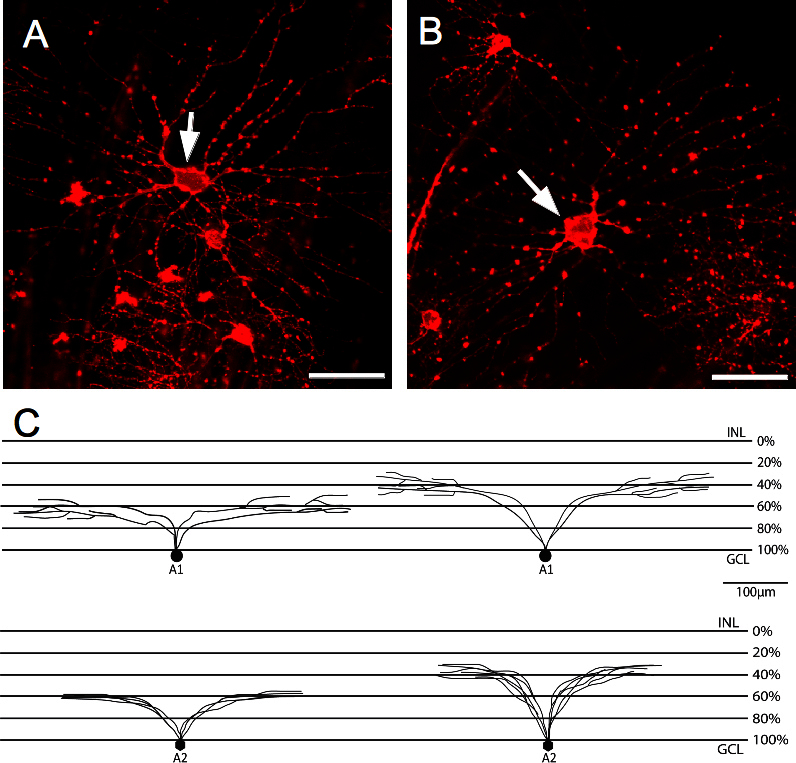
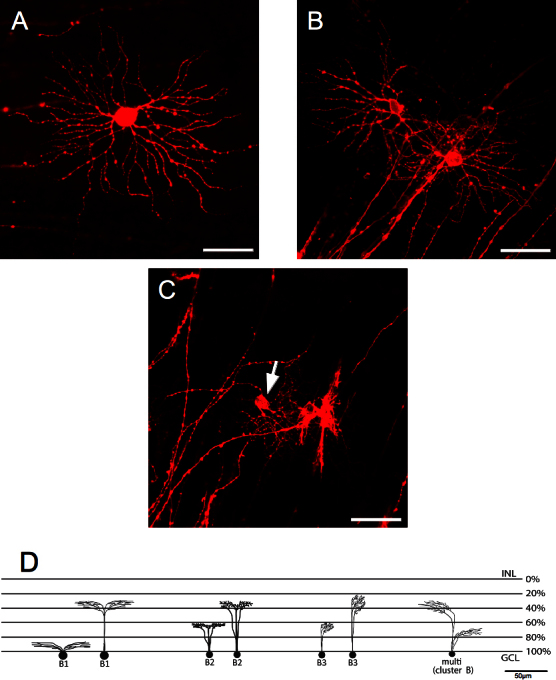
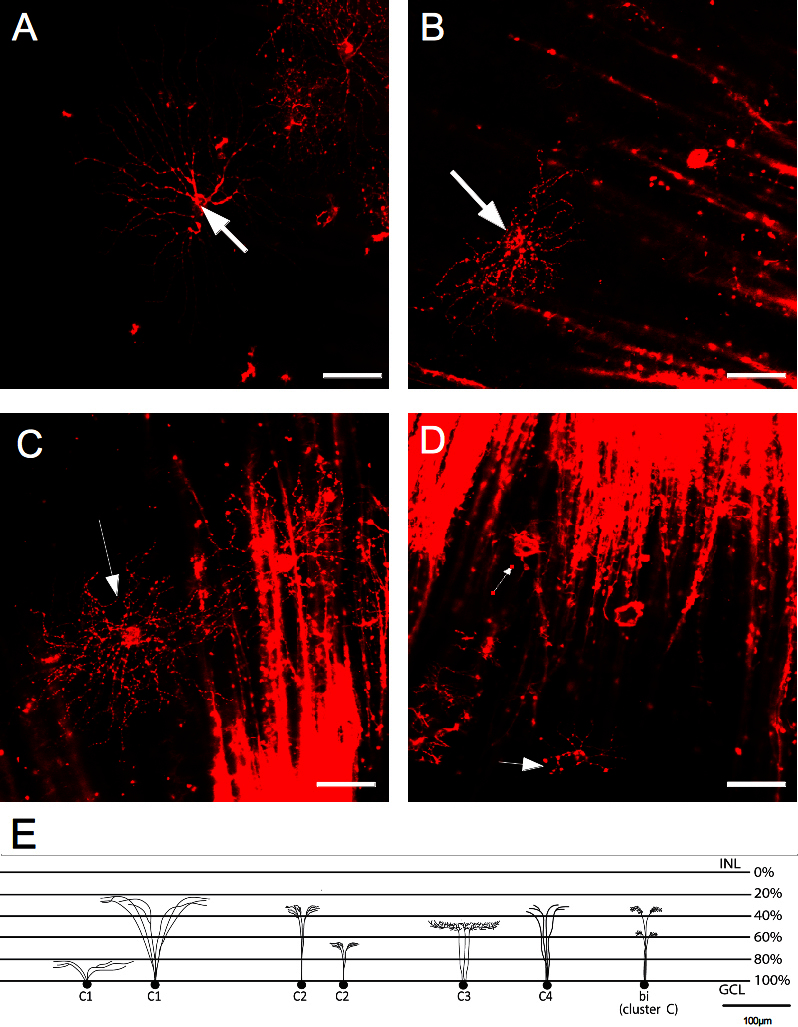
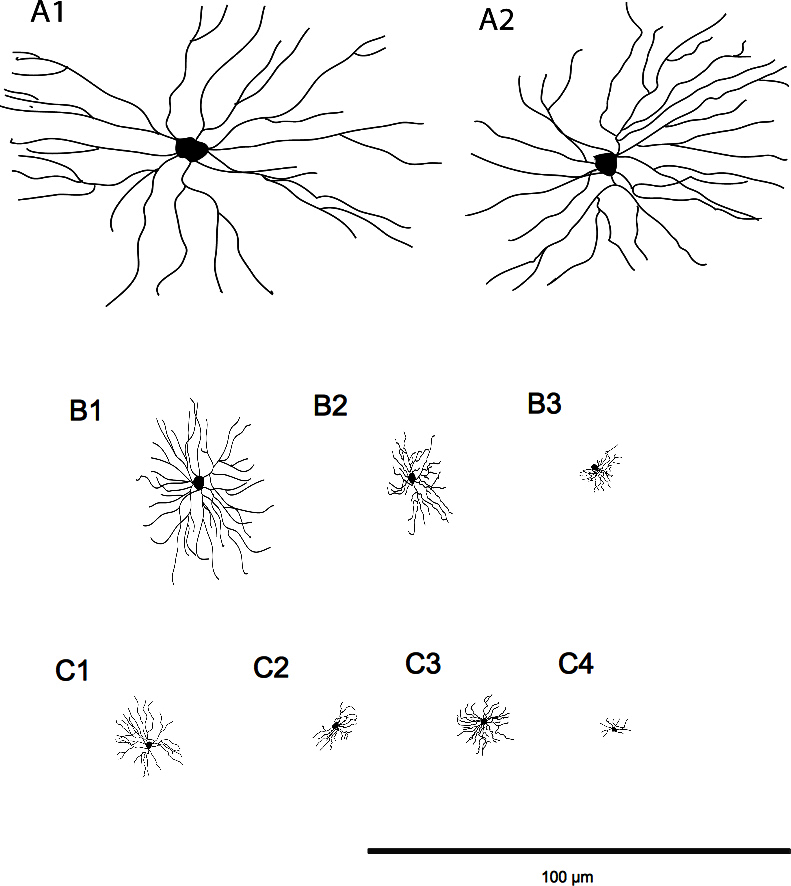
Results: RGC distribution in clusters was achieved according to their morphological parameters. It was feasible to combine both statistical methods, thereby obtaining a robust clustering distribution. Morphological analysis resulted in a classification of RGCs in three groups according to the soma size and dendritic field: A (large somas and large dendritic fields), B (medium to large somas and medium to large dendritic fields), C (medium to small somas and medium to small dendritic fields). Within groups, fine clustering defined several subgroups according to dendritic arborization and level of stratification. Additionally, cells stratifying in two different levels of the inner plexiform layer were observed within the clusters.
Conclusions: This comprehensive study of RGC morphologies in the porcine retina provides fundamental knowledge about RGC cell types and provides a basis for functional studies toward selective RGC cell degeneration in retinal disorders.
Figures
Similar articles
-
Topography of pig retinal ganglion cells.J Comp Neurol. 2005 Jun 13;486(4):361-72. doi: 10.1002/cne.20516. J Comp Neurol. 2005. PMID: 15846788
-
Retinal ganglion cells in two teleost species, Sebastiscus marmoratus and Navodon modestus.J Comp Neurol. 1984 Oct 10;229(1):80-96. doi: 10.1002/cne.902290107. J Comp Neurol. 1984. PMID: 6490977
-
Morphological identification and systematic classification of mammalian retinal ganglion cells. I. Rabbit retinal ganglion cells.J Comp Neurol. 2020 Dec 15;528(18):3305-3450. doi: 10.1002/cne.24998. Epub 2020 Dec 4. J Comp Neurol. 2020. PMID: 32725618
-
Mapping retinal ganglion cell somas in a large-eyed glaucoma model.Mol Vis. 2021 Nov 19;27:608-621. eCollection 2021. Mol Vis. 2021. PMID: 34924741 Free PMC article.
-
Morphological multivariate cluster analysis of murine retinal ganglion cells selectively expressing yellow fluorescent protein.Exp Eye Res. 2020 Jul;196:108044. doi: 10.1016/j.exer.2020.108044. Epub 2020 May 4. Exp Eye Res. 2020. PMID: 32376469
Cited by
-
Retinal ganglion cell repopulation for vision restoration in optic neuropathy: a roadmap from the RReSTORe Consortium.Mol Neurodegener. 2023 Sep 21;18(1):64. doi: 10.1186/s13024-023-00655-y. Mol Neurodegener. 2023. PMID: 37735444 Free PMC article. Review.
-
Comparative lipidomic analysis of mammalian retinal ganglion cells and Müller glia in situ and in vitro using High-Resolution Imaging Mass Spectrometry.Sci Rep. 2020 Nov 18;10(1):20053. doi: 10.1038/s41598-020-77087-x. Sci Rep. 2020. PMID: 33208898 Free PMC article.
References
-
- Sharma SC, Li J, Vecino E. Adaptive changes in the retina and central visual areas in glaucoma (2011): 57–64. In Glaucoma - Basic and Clinical Concepts, Edited by Shimon Rumelt. ISBN 978–953–307–591–4.
-
- Dacey DM, Peterson BB, Robinson FR, Gamlin PD. Fireworks in the primate retina: in vitro photodynamics reveals diverse LGN-projecting ganglion cell types. Neuron. 2003;37:15–27. - PubMed
-
- Huxlin KR, Goodchild AK. Retinal ganglion cells in the albino rat: revised morphological classification. J Comp Neurol. 1997;385:309–23. - PubMed
Publication types
MeSH terms
LinkOut - more resources
Full Text Sources